Status: Done started: 2018-Nov-07 16:35:07 UTC
| Project Name | |
| Sequence | LTATSVEKFL IEKFDSVSDL MQLSEGEESR AFSFDVGGRG YVLRVNSCAD GFYKDRYVYR HFASAALPIP EVLDIGEFSE SLTYCISRRA QGVTLQDLPE TELPAVLQPV AEAMDAIAAA DLSQTSGFGP FGPQGIGQYT TWRDFICAIA DPHVYHWQTV MDDTVSASVA QALDELMLWA EDCPEVRHLV HADFGSNNVL TDNGRITAVI DWSEAMFGDS QYEVANIFFW RPWLACMEQQ TRYFERRHPE LAGSPRLRAY MLRIGLDQLY QSLVDGNFDD AAWAQGRCDA IVRSGAGT |
| Secondary structure | CCHHHHHHHH HHCCCCCEEE EEEEEECCEE EEEEEECCEE EEEEEECCCH HHHHHHHHHH HHCCCCCCCC CEEEEEECCC CCEEEEEECC CCEECCCCCC CCHHHHHHHH HHHHHHHHHC CCCCCCCEEE ECCCCCEEEC CHHHHHHCCC CCCCCCCCCC CCHHHHHHHH HHHHHHHHHC CCCCCCCEEE CCCCCCCCEE EECCEEEEEC CCCCCEEECH HHHHHHHHHH CCCCHHHHHH HHHHHHHCCC CCCCHHHHHH HHHHHHHHHH HHHHHCCHHH HHHHHHHHHH HHHHHCCC |
| Movie from predicted structures | To download the movie, right click on the desired file format:  
|
| Estimated finish time | 2018-Nov-07 20:33 UTC |
| Project Name |

| Project Name |
| Cluster # | 1 | 2 | 3 | 4 | 5 | 6 | 7 | 8 | 9 | 10 | 11 | 12 |
| Cluster density | 221.6 | 190.9 | 184.9 | 164.3 | 152.5 | 152.1 | 137.0 | 136.0 | 132.8 | 127.6 | 118.4 | 74.8 |
| Cluster size | 254 | 208 | 218 | 174 | 164 | 186 | 155 | 148 | 152 | 144 | 122 | 75 |
| Average cluster RMSD | 1.1 | 1.1 | 1.2 | 1.1 | 1.1 | 1.2 | 1.1 | 1.1 | 1.1 | 1.1 | 1.0 | 1.0 |
| # | 1 | 2 | 3 | 4 | 5 | 6 | 7 | 8 | 9 | 10 | 11 | 12 |
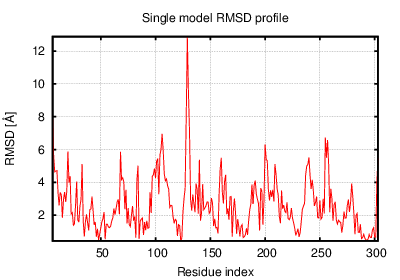
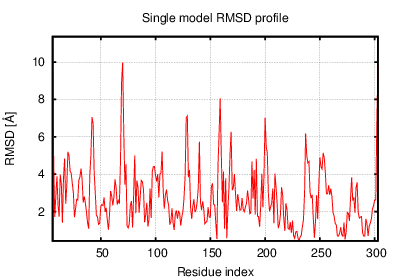
| RMSD | 2.83 | 2.92 | 3.22 | 3.20 | 3.22 | 2.70 | 2.98 | 3.43 | 3.14 | 2.94 | 2.97 | 3.03 |
| GDT_TS | 0.66 | 0.61 | 0.58 | 0.60 | 0.60 | 0.67 | 0.64 | 0.57 | 0.58 | 0.61 | 0.61 | 0.62 |
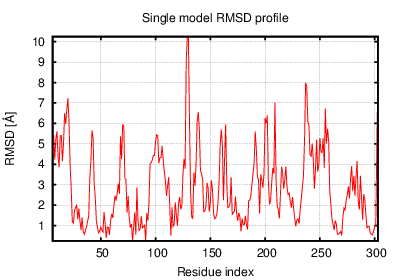
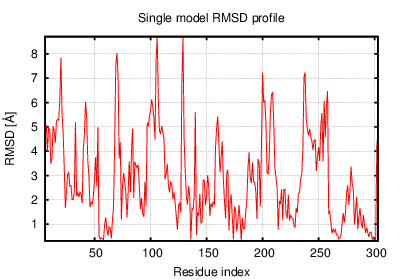
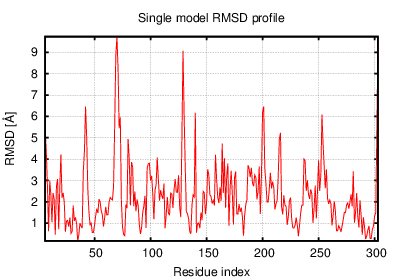
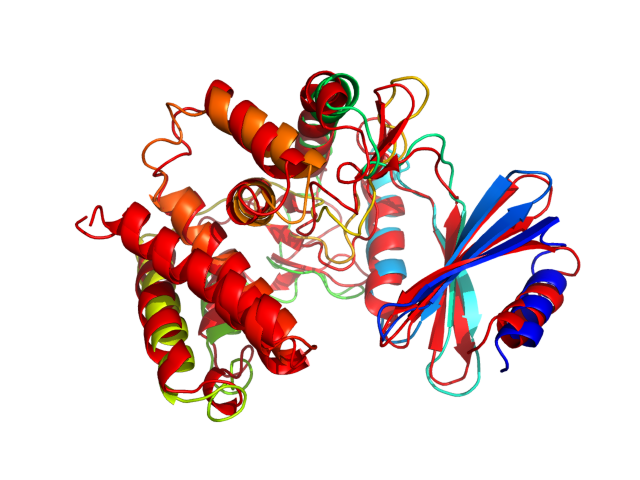
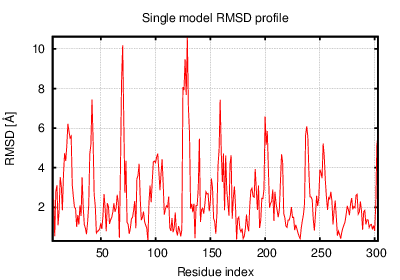
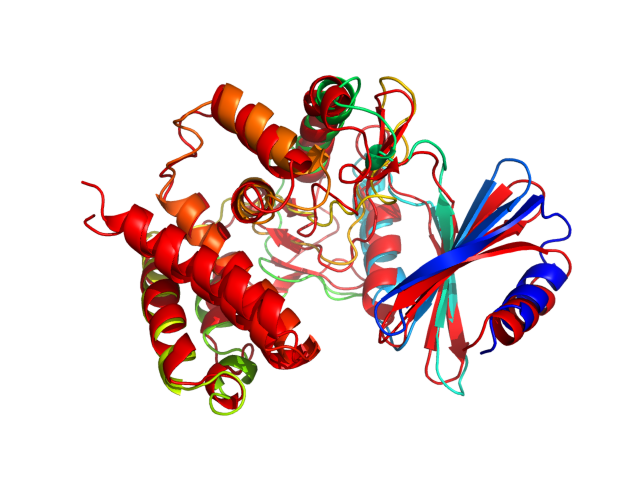
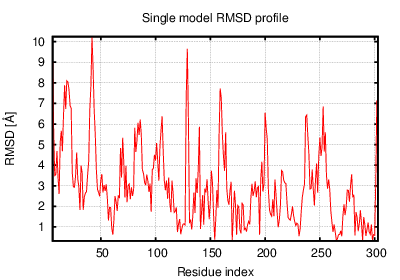
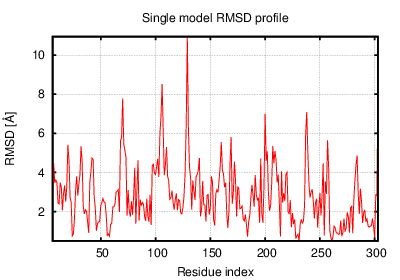
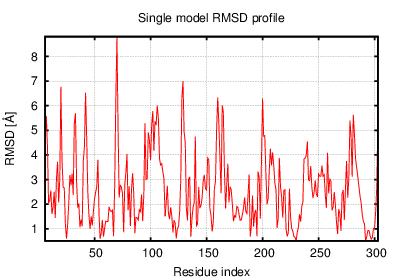
The table contains RMSD and GDT_TS values (calculated on the Cα atoms) between the predicted models and the input structure. Note that GDT_TS metric is intended as a more accurate measurement than the more common RMSD.
Read more about the root-mean-square deviation (RMSD) measure
Read more about the global distance test (GDT, also written as GDT_TS to represent "total score") measure.
| # | 1 | 2 | 3 | 4 | 5 | 6 | 7 | 8 | 9 | 10 | 11 | 12 |
| 1 | 0.00 | 1.83 | 2.50 | 2.07 | 2.12 | 2.35 | 2.22 | 2.12 | 2.00 | 2.21 | 2.36 | 1.75 |
| 2 | 1.83 | 0.00 | 2.48 | 1.90 | 1.88 | 2.34 | 2.35 | 2.29 | 1.66 | 2.08 | 2.25 | 1.94 |
| 3 | 2.50 | 2.48 | 0.00 | 2.49 | 2.57 | 2.30 | 2.04 | 2.31 | 2.41 | 2.37 | 2.65 | 2.17 |
| 4 | 2.07 | 1.90 | 2.49 | 0.00 | 1.97 | 2.40 | 2.20 | 2.21 | 2.11 | 2.24 | 2.27 | 1.90 |
| 5 | 2.12 | 1.88 | 2.57 | 1.97 | 0.00 | 2.52 | 2.39 | 2.23 | 1.65 | 2.17 | 2.46 | 2.22 |
| 6 | 2.35 | 2.34 | 2.30 | 2.40 | 2.52 | 0.00 | 2.01 | 2.43 | 2.37 | 2.31 | 2.38 | 2.23 |
| 7 | 2.22 | 2.35 | 2.04 | 2.20 | 2.39 | 2.01 | 0.00 | 2.34 | 2.40 | 2.13 | 2.47 | 2.06 |
| 8 | 2.12 | 2.29 | 2.31 | 2.21 | 2.23 | 2.43 | 2.34 | 0.00 | 2.21 | 2.50 | 2.71 | 2.25 |
| 9 | 2.00 | 1.66 | 2.41 | 2.11 | 1.65 | 2.37 | 2.40 | 2.21 | 0.00 | 2.11 | 2.36 | 2.11 |
| 10 | 2.21 | 2.08 | 2.37 | 2.24 | 2.17 | 2.31 | 2.13 | 2.50 | 2.11 | 0.00 | 1.98 | 2.17 |
| 11 | 2.36 | 2.25 | 2.65 | 2.27 | 2.46 | 2.38 | 2.47 | 2.71 | 2.36 | 1.98 | 0.00 | 2.20 |
| 12 | 1.75 | 1.94 | 2.17 | 1.90 | 2.22 | 2.23 | 2.06 | 2.25 | 2.11 | 2.17 | 2.20 | 0.00 |
The table contains RMSD values (calculated on the Cα atoms) between the predicted models.
Read more about the root-mean-square deviation (RMSD) measure.
| # | 1 | 2 | 3 | 4 | 5 | 6 | 7 | 8 | 9 | 10 | 11 | 12 |
| 1 | 1.00 | 0.77 | 0.71 | 0.75 | 0.73 | 0.73 | 0.74 | 0.72 | 0.74 | 0.73 | 0.73 | 0.80 |
| 2 | 0.77 | 1.00 | 0.71 | 0.74 | 0.78 | 0.70 | 0.72 | 0.70 | 0.81 | 0.77 | 0.76 | 0.76 |
| 3 | 0.71 | 0.71 | 1.00 | 0.69 | 0.68 | 0.70 | 0.76 | 0.69 | 0.71 | 0.71 | 0.69 | 0.74 |
| 4 | 0.75 | 0.74 | 0.69 | 1.00 | 0.75 | 0.70 | 0.74 | 0.74 | 0.72 | 0.72 | 0.73 | 0.77 |
| 5 | 0.73 | 0.78 | 0.68 | 0.75 | 1.00 | 0.69 | 0.72 | 0.71 | 0.81 | 0.73 | 0.70 | 0.72 |
| 6 | 0.73 | 0.70 | 0.70 | 0.70 | 0.69 | 1.00 | 0.78 | 0.69 | 0.68 | 0.72 | 0.69 | 0.72 |
| 7 | 0.74 | 0.72 | 0.76 | 0.74 | 0.72 | 0.78 | 1.00 | 0.71 | 0.70 | 0.74 | 0.72 | 0.75 |
| 8 | 0.72 | 0.70 | 0.69 | 0.74 | 0.71 | 0.69 | 0.71 | 1.00 | 0.71 | 0.67 | 0.67 | 0.71 |
| 9 | 0.74 | 0.81 | 0.71 | 0.72 | 0.81 | 0.68 | 0.70 | 0.71 | 1.00 | 0.74 | 0.71 | 0.74 |
| 10 | 0.73 | 0.77 | 0.71 | 0.72 | 0.73 | 0.72 | 0.74 | 0.67 | 0.74 | 1.00 | 0.77 | 0.74 |
| 11 | 0.73 | 0.76 | 0.69 | 0.73 | 0.70 | 0.69 | 0.72 | 0.67 | 0.71 | 0.77 | 1.00 | 0.75 |
| 12 | 0.80 | 0.76 | 0.74 | 0.77 | 0.72 | 0.72 | 0.75 | 0.71 | 0.74 | 0.74 | 0.75 | 1.00 |
The table contains GDT_TS values (calculated on the Cα atoms) between the predicted models.
Read more about the global distance test (GDT, also written as GDT_TS to represent "total score") measure.
© Laboratory of Theory of Biopolymers, Faculty of Chemistry, University of Warsaw 2013