Status: Done started: 2018-Jun-29 06:10:28 UTC
| Project Name | |
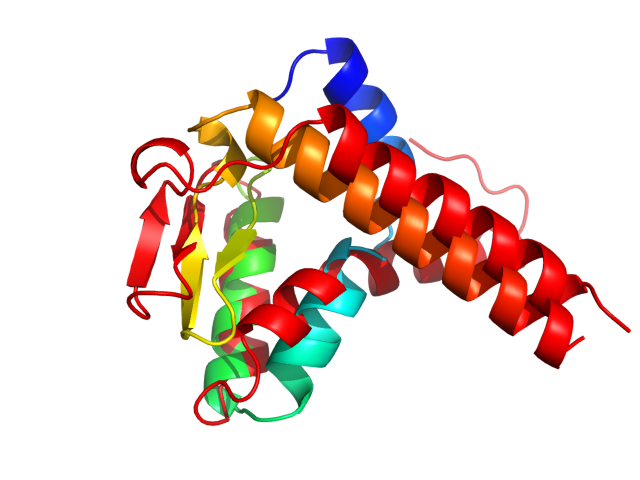
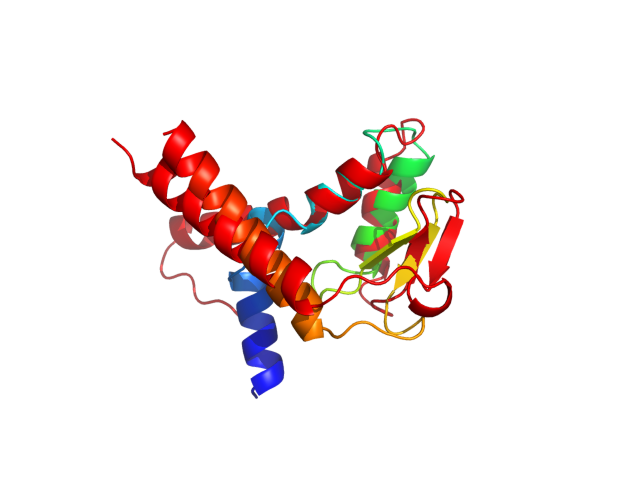
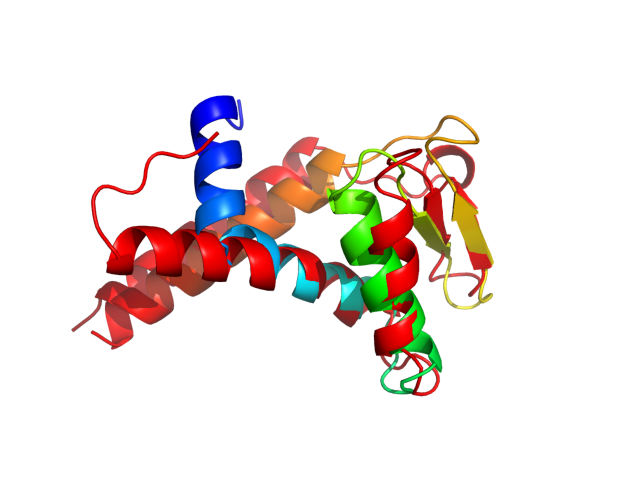
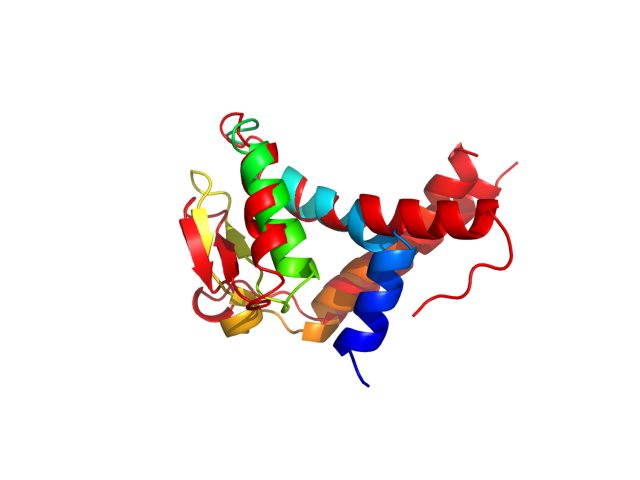
| Sequence | NLSPANFDQK LGIGIVKSAL QKPAKTIVDN AGEEGAVIVG KILDNHVDDF NYGYDAAKGE YGDLVSRGIV DPLKVVRTAL VDASGVASLL TTTE |
| Secondary structure | CCCCCCHHHH HHHHHHHHHC CHHHHHHHCC CCCCHHHHHH HHHHCCCCCC CEEEECCCCE EEECCCCCCC CCHHHHHHHH HHHHHHHHHH HHCC |
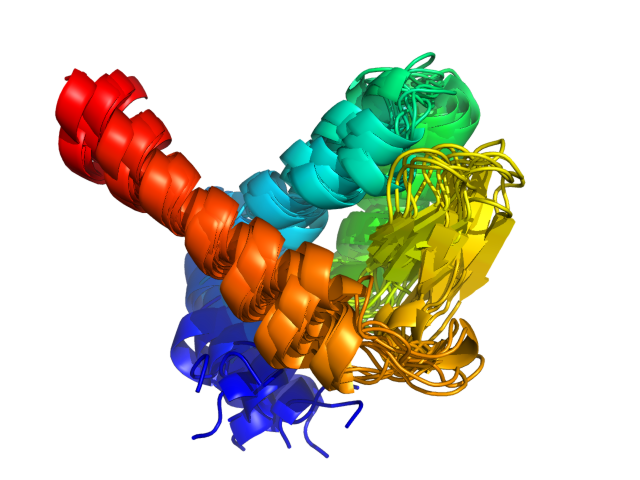
| Movie from predicted structures | To download the movie, right click on the desired file format:  
|
| Estimated finish time | 2018-Jun-29 10:41 UTC |
| Project Name |


| Project Name |
| Cluster # | 1 | 2 | 3 | 4 | 5 | 6 | 7 | 8 | 9 | 10 | 11 | 12 |
| Cluster density | 148.1 | 133.9 | 119.4 | 102.7 | 95.6 | 94.9 | 93.1 | 92.7 | 89.8 | 78.6 | 66.2 | 59.3 |
| Cluster size | 248 | 221 | 259 | 152 | 157 | 170 | 152 | 146 | 142 | 146 | 103 | 104 |
| Average cluster RMSD | 1.7 | 1.7 | 2.2 | 1.5 | 1.6 | 1.8 | 1.6 | 1.6 | 1.6 | 1.9 | 1.6 | 1.8 |
| # | 1 | 2 | 3 | 4 | 5 | 6 | 7 | 8 | 9 | 10 | 11 | 12 |
| RMSD | 5.93 | 6.55 | 6.98 | 8.03 | 6.94 | 7.10 | 5.53 | 7.05 | 7.95 | 6.90 | 6.02 | 6.40 |
| GDT_TS | 0.49 | 0.44 | 0.49 | 0.43 | 0.44 | 0.49 | 0.50 | 0.45 | 0.43 | 0.45 | 0.50 | 0.48 |
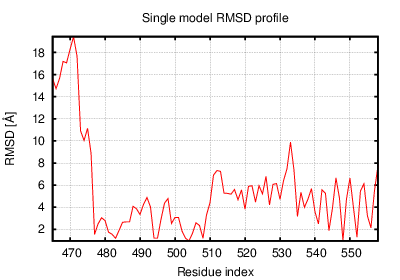
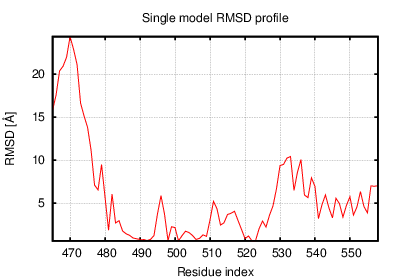
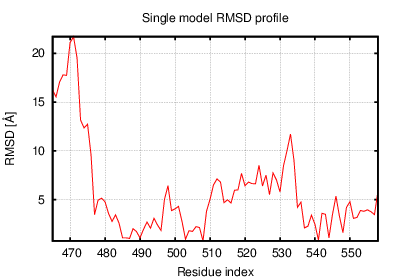
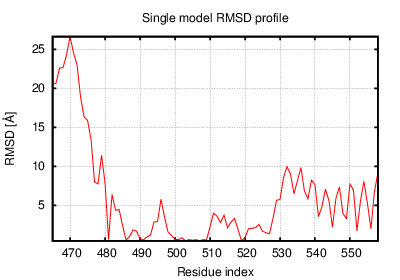
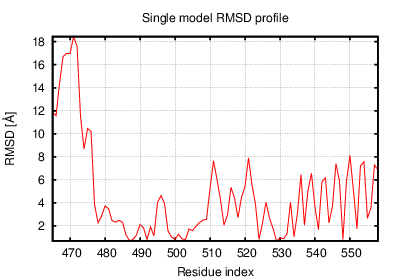
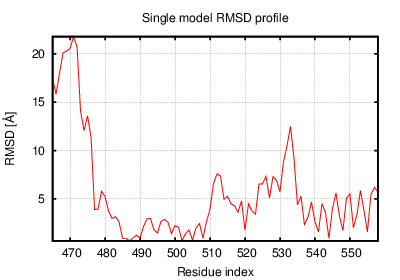
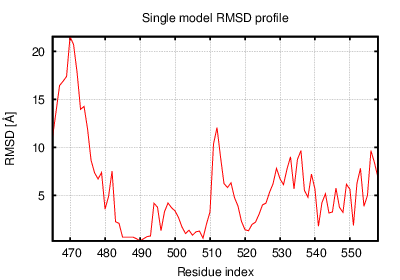
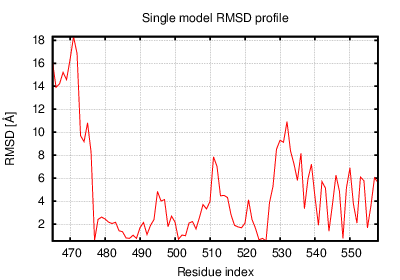
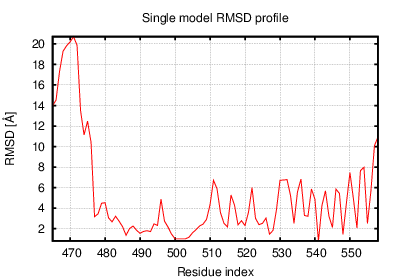
The table contains RMSD and GDT_TS values (calculated on the Cα atoms) between the predicted models and the input structure. Note that GDT_TS metric is intended as a more accurate measurement than the more common RMSD.
Read more about the root-mean-square deviation (RMSD) measure
Read more about the global distance test (GDT, also written as GDT_TS to represent "total score") measure.
| # | 1 | 2 | 3 | 4 | 5 | 6 | 7 | 8 | 9 | 10 | 11 | 12 |
| 1 | 0.00 | 2.92 | 4.21 | 4.90 | 3.46 | 4.33 | 3.06 | 3.81 | 4.85 | 4.34 | 3.24 | 3.42 |
| 2 | 2.92 | 0.00 | 3.75 | 3.73 | 1.53 | 4.16 | 3.98 | 2.35 | 3.72 | 3.71 | 3.44 | 3.39 |
| 3 | 4.21 | 3.75 | 0.00 | 4.05 | 3.65 | 1.79 | 4.03 | 3.50 | 3.06 | 2.21 | 3.98 | 2.77 |
| 4 | 4.90 | 3.73 | 4.05 | 0.00 | 2.96 | 4.37 | 5.69 | 3.28 | 2.77 | 4.30 | 5.14 | 4.80 |
| 5 | 3.46 | 1.53 | 3.65 | 2.96 | 0.00 | 3.91 | 4.36 | 2.14 | 3.17 | 3.59 | 3.92 | 3.56 |
| 6 | 4.33 | 4.16 | 1.79 | 4.37 | 3.91 | 0.00 | 3.93 | 3.90 | 3.53 | 2.76 | 4.25 | 2.79 |
| 7 | 3.06 | 3.98 | 4.03 | 5.69 | 4.36 | 3.93 | 0.00 | 4.21 | 5.39 | 4.15 | 3.22 | 2.63 |
| 8 | 3.81 | 2.35 | 3.50 | 3.28 | 2.14 | 3.90 | 4.21 | 0.00 | 3.49 | 3.37 | 3.70 | 3.22 |
| 9 | 4.85 | 3.72 | 3.06 | 2.77 | 3.17 | 3.53 | 5.39 | 3.49 | 0.00 | 3.42 | 5.05 | 4.36 |
| 10 | 4.34 | 3.71 | 2.21 | 4.30 | 3.59 | 2.76 | 4.15 | 3.37 | 3.42 | 0.00 | 4.15 | 3.18 |
| 11 | 3.24 | 3.44 | 3.98 | 5.14 | 3.92 | 4.25 | 3.22 | 3.70 | 5.05 | 4.15 | 0.00 | 3.28 |
| 12 | 3.42 | 3.39 | 2.77 | 4.80 | 3.56 | 2.79 | 2.63 | 3.22 | 4.36 | 3.18 | 3.28 | 0.00 |
The table contains RMSD values (calculated on the Cα atoms) between the predicted models.
Read more about the root-mean-square deviation (RMSD) measure.
| # | 1 | 2 | 3 | 4 | 5 | 6 | 7 | 8 | 9 | 10 | 11 | 12 |
| 1 | 1.00 | 0.67 | 0.55 | 0.51 | 0.60 | 0.57 | 0.65 | 0.56 | 0.53 | 0.55 | 0.66 | 0.64 |
| 2 | 0.67 | 1.00 | 0.56 | 0.58 | 0.83 | 0.55 | 0.58 | 0.72 | 0.60 | 0.58 | 0.65 | 0.61 |
| 3 | 0.55 | 0.56 | 1.00 | 0.52 | 0.56 | 0.78 | 0.58 | 0.59 | 0.64 | 0.75 | 0.59 | 0.69 |
| 4 | 0.51 | 0.58 | 0.52 | 1.00 | 0.67 | 0.52 | 0.46 | 0.65 | 0.66 | 0.55 | 0.49 | 0.51 |
| 5 | 0.60 | 0.83 | 0.56 | 0.67 | 1.00 | 0.55 | 0.55 | 0.80 | 0.62 | 0.60 | 0.60 | 0.59 |
| 6 | 0.57 | 0.55 | 0.78 | 0.52 | 0.55 | 1.00 | 0.63 | 0.58 | 0.59 | 0.68 | 0.61 | 0.70 |
| 7 | 0.65 | 0.58 | 0.58 | 0.46 | 0.55 | 0.63 | 1.00 | 0.54 | 0.51 | 0.58 | 0.66 | 0.69 |
| 8 | 0.56 | 0.72 | 0.59 | 0.65 | 0.80 | 0.58 | 0.54 | 1.00 | 0.65 | 0.64 | 0.60 | 0.60 |
| 9 | 0.53 | 0.60 | 0.64 | 0.66 | 0.62 | 0.59 | 0.51 | 0.65 | 1.00 | 0.69 | 0.52 | 0.56 |
| 10 | 0.55 | 0.58 | 0.75 | 0.55 | 0.60 | 0.68 | 0.58 | 0.64 | 0.69 | 1.00 | 0.57 | 0.62 |
| 11 | 0.66 | 0.65 | 0.59 | 0.49 | 0.60 | 0.61 | 0.66 | 0.60 | 0.52 | 0.57 | 1.00 | 0.64 |
| 12 | 0.64 | 0.61 | 0.69 | 0.51 | 0.59 | 0.70 | 0.69 | 0.60 | 0.56 | 0.62 | 0.64 | 1.00 |
The table contains GDT_TS values (calculated on the Cα atoms) between the predicted models.
Read more about the global distance test (GDT, also written as GDT_TS to represent "total score") measure.
© Laboratory of Theory of Biopolymers, Faculty of Chemistry, University of Warsaw 2013