Status: Done started: 2018-Jul-10 12:50:56 UTC
| Project Name | |
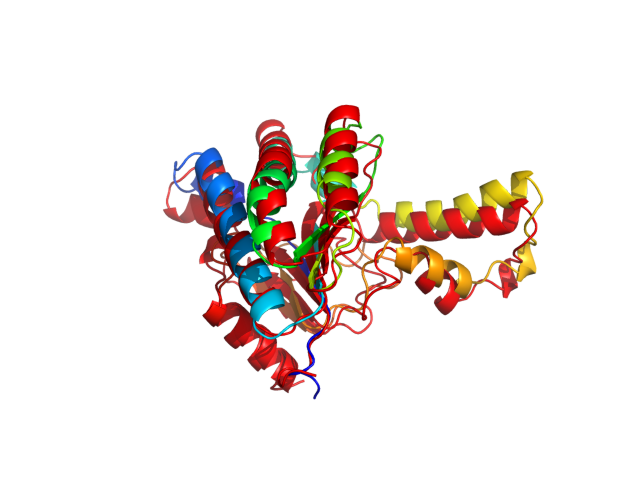
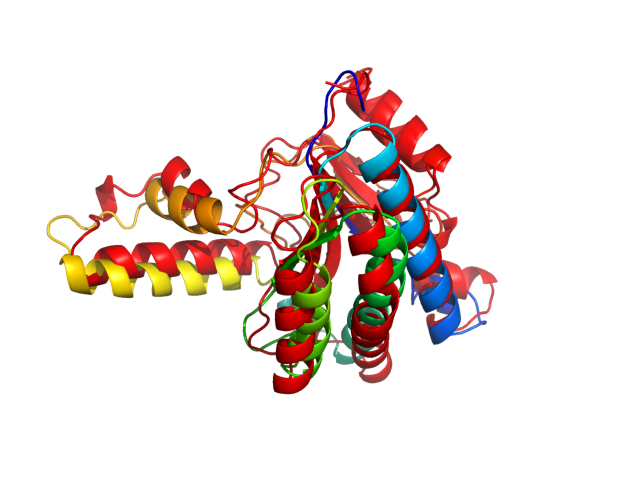
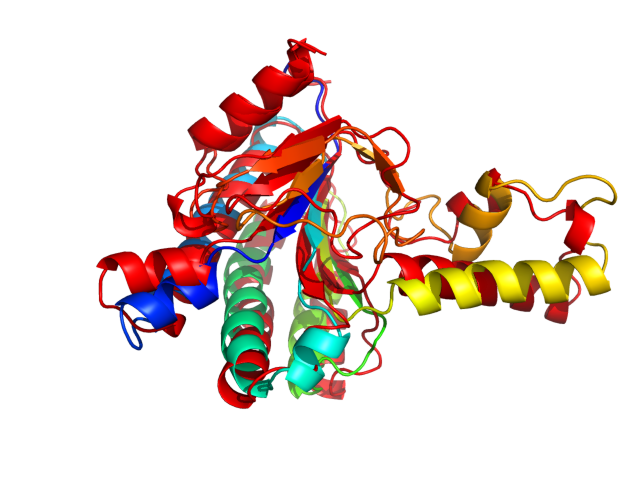
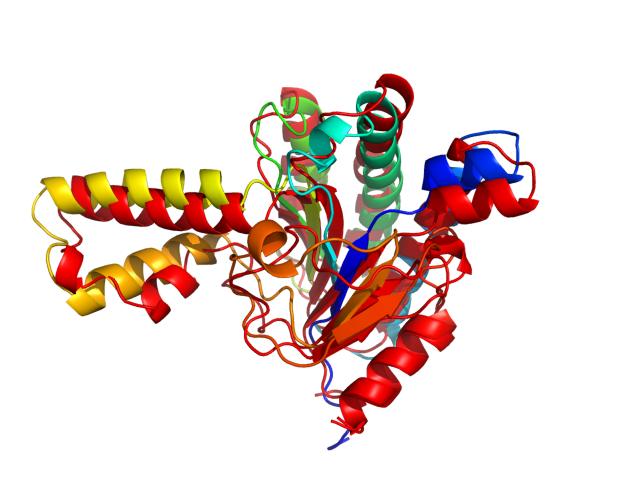
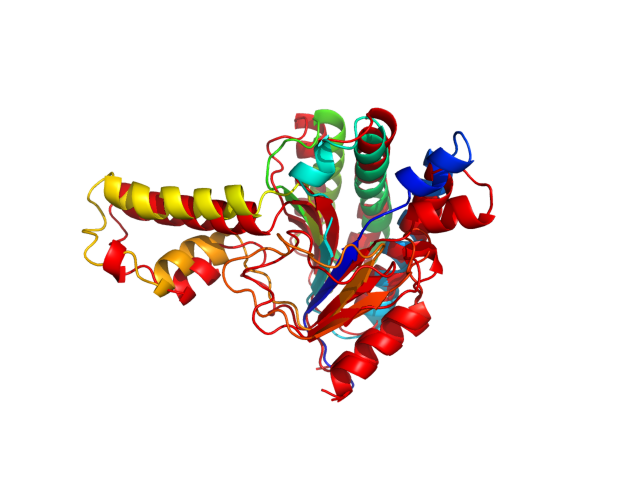
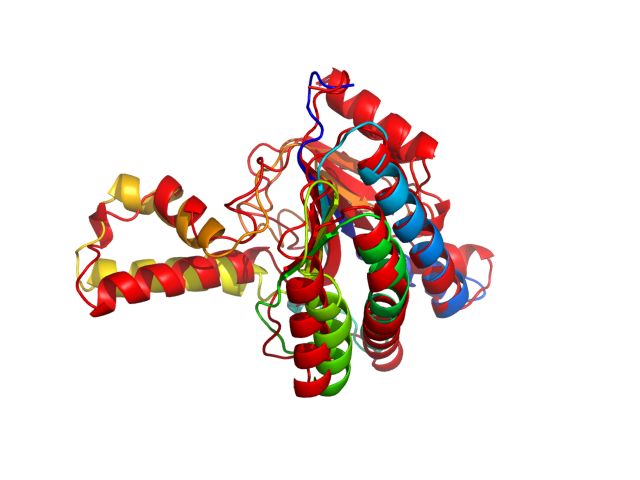
| Sequence | LPAHGCRHVA IIMDGNGRWA KKQGKIRAFG HKAGAKSVRR AVSFAANNGI EALTLYAFSS ENWNRPAQEV SALMELFVWA LDSEVKSLHR HNVRLRIIGD TSRFNSRLQE RIRKSEALTA GNTGLTLNIA ANYGGRWDIV QGVRQLAEKV QQGNLQPDQI DEEMLNQHVC MHELAPVDLV IRTGGEHRIS NFLLWQIAYA ELYFTDVLWP DFDEQDFEGA LNAFANR |
| Secondary structure | CCCCCCCEEE EECCCHHHHH HHCCCCHHHH HHHHHHHHHH HHHHHHHCCC CEEEEEEEEC CCCCCCHHHH HHHHHHHHHH HHHCHHHHHH CCCEEEEECC CCCCCHHHHH HHHHHHHHHC CCCCCEEEEE EEECHHHHHH HHHHHHHHHH HCCCCCCCCC CHHHHHCCCC CCCCCCCCEE EECCCCCCCC CCCCCCCCCC EEEECCCCCC CCCHHHHHHH HHHHHCC |
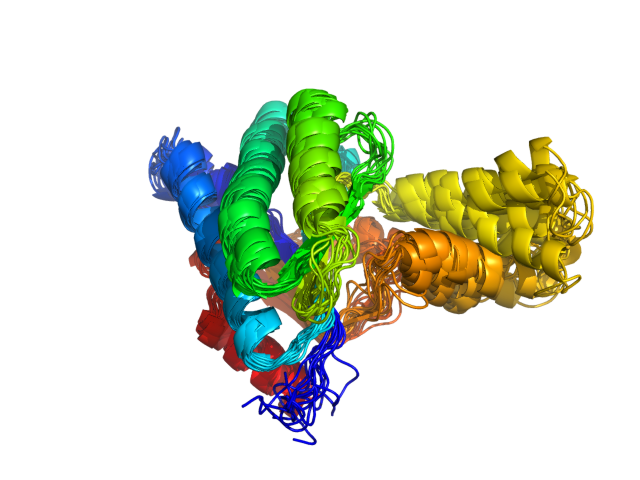
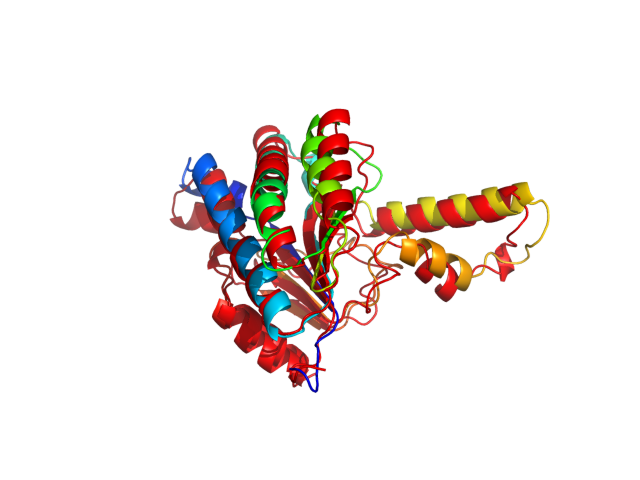
| Movie from predicted structures | To download the movie, right click on the desired file format:  
|
| Estimated finish time | 2018-Jul-10 17:39 UTC |
| Project Name |

| Project Name |
| Cluster # | 1 | 2 | 3 | 4 | 5 | 6 | 7 | 8 | 9 | 10 | 11 | 12 |
| Cluster density | 183.8 | 174.1 | 144.2 | 142.2 | 133.0 | 120.9 | 112.4 | 110.7 | 98.2 | 98.0 | 90.4 | 83.8 |
| Cluster size | 259 | 221 | 178 | 211 | 183 | 149 | 161 | 154 | 129 | 135 | 116 | 104 |
| Average cluster RMSD | 1.4 | 1.3 | 1.2 | 1.5 | 1.4 | 1.2 | 1.4 | 1.4 | 1.3 | 1.4 | 1.3 | 1.2 |
| # | 1 | 2 | 3 | 4 | 5 | 6 | 7 | 8 | 9 | 10 | 11 | 12 |
| RMSD | 2.97 | 3.17 | 3.19 | 2.97 | 2.87 | 3.18 | 3.02 | 2.95 | 2.88 | 3.22 | 2.95 | 3.06 |
| GDT_TS | 0.62 | 0.61 | 0.62 | 0.61 | 0.62 | 0.60 | 0.60 | 0.62 | 0.61 | 0.61 | 0.64 | 0.64 |
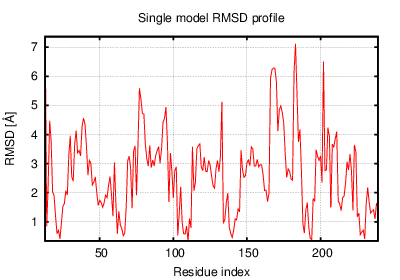
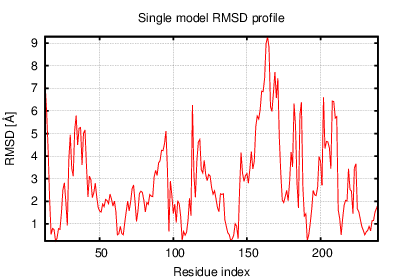
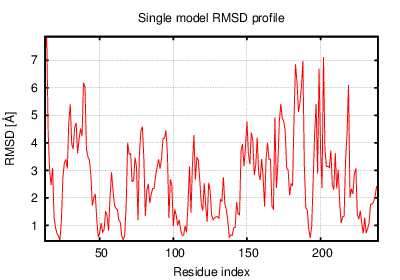
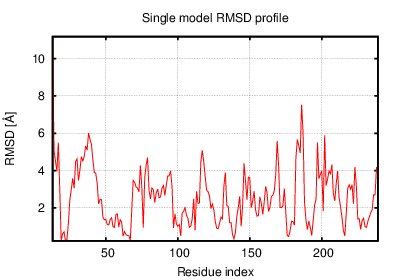
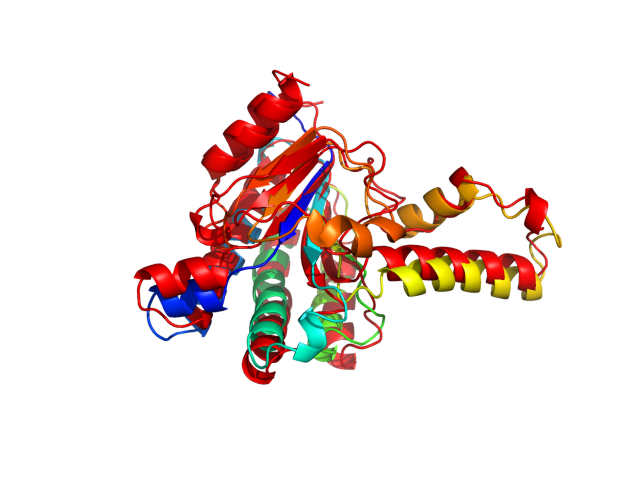
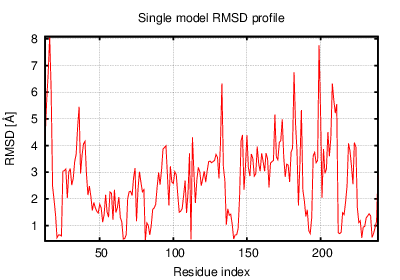
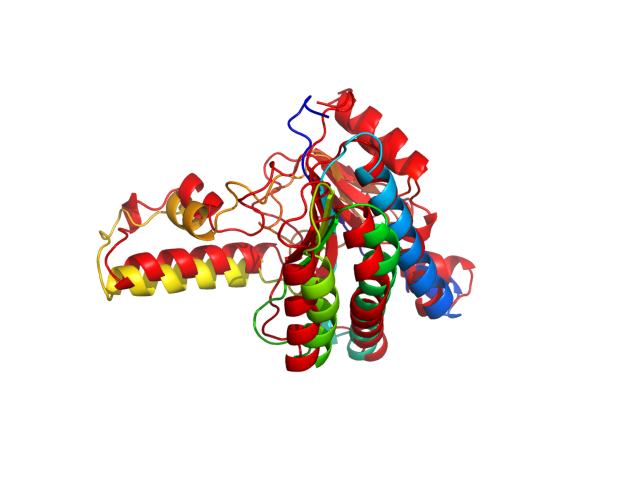
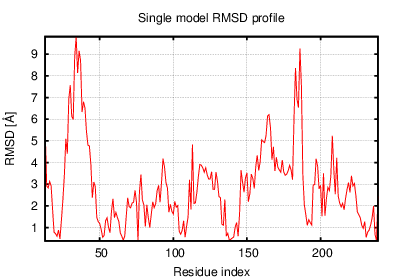
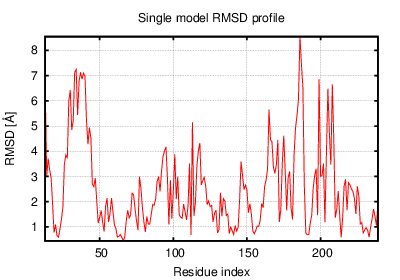
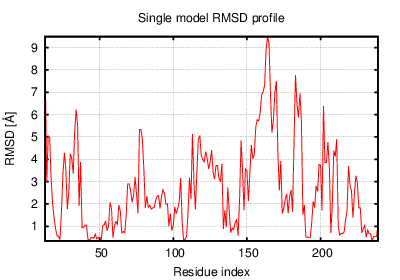
The table contains RMSD and GDT_TS values (calculated on the Cα atoms) between the predicted models and the input structure. Note that GDT_TS metric is intended as a more accurate measurement than the more common RMSD.
Read more about the root-mean-square deviation (RMSD) measure
Read more about the global distance test (GDT, also written as GDT_TS to represent "total score") measure.
| # | 1 | 2 | 3 | 4 | 5 | 6 | 7 | 8 | 9 | 10 | 11 | 12 |
| 1 | 0.00 | 2.65 | 2.57 | 2.23 | 2.10 | 2.91 | 2.24 | 2.22 | 2.44 | 1.78 | 2.34 | 2.94 |
| 2 | 2.65 | 0.00 | 1.49 | 3.12 | 2.84 | 2.48 | 2.78 | 2.69 | 2.85 | 2.71 | 1.74 | 2.72 |
| 3 | 2.57 | 1.49 | 0.00 | 3.06 | 2.68 | 2.70 | 2.70 | 2.60 | 2.86 | 2.92 | 1.93 | 2.97 |
| 4 | 2.23 | 3.12 | 3.06 | 0.00 | 2.02 | 3.19 | 2.19 | 2.41 | 2.52 | 2.54 | 3.01 | 3.03 |
| 5 | 2.10 | 2.84 | 2.68 | 2.02 | 0.00 | 2.83 | 2.35 | 2.20 | 2.11 | 2.36 | 2.71 | 2.81 |
| 6 | 2.91 | 2.48 | 2.70 | 3.19 | 2.83 | 0.00 | 2.69 | 3.14 | 2.39 | 2.72 | 2.79 | 2.00 |
| 7 | 2.24 | 2.78 | 2.70 | 2.19 | 2.35 | 2.69 | 0.00 | 2.22 | 2.51 | 2.27 | 2.51 | 2.70 |
| 8 | 2.22 | 2.69 | 2.60 | 2.41 | 2.20 | 3.14 | 2.22 | 0.00 | 2.88 | 2.37 | 2.25 | 3.26 |
| 9 | 2.44 | 2.85 | 2.86 | 2.52 | 2.11 | 2.39 | 2.51 | 2.88 | 0.00 | 2.63 | 2.88 | 2.59 |
| 10 | 1.78 | 2.71 | 2.92 | 2.54 | 2.36 | 2.72 | 2.27 | 2.37 | 2.63 | 0.00 | 2.40 | 2.73 |
| 11 | 2.34 | 1.74 | 1.93 | 3.01 | 2.71 | 2.79 | 2.51 | 2.25 | 2.88 | 2.40 | 0.00 | 2.95 |
| 12 | 2.94 | 2.72 | 2.97 | 3.03 | 2.81 | 2.00 | 2.70 | 3.26 | 2.59 | 2.73 | 2.95 | 0.00 |
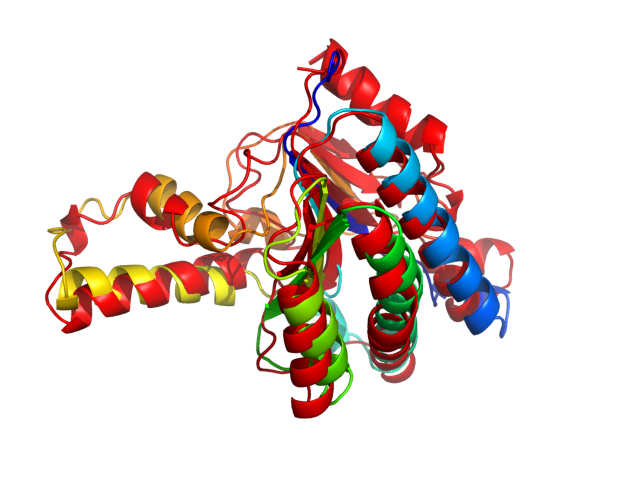
The table contains RMSD values (calculated on the Cα atoms) between the predicted models.
Read more about the root-mean-square deviation (RMSD) measure.
| # | 1 | 2 | 3 | 4 | 5 | 6 | 7 | 8 | 9 | 10 | 11 | 12 |
| 1 | 1.00 | 0.75 | 0.75 | 0.75 | 0.71 | 0.70 | 0.73 | 0.73 | 0.72 | 0.80 | 0.77 | 0.69 |
| 2 | 0.75 | 1.00 | 0.84 | 0.72 | 0.69 | 0.71 | 0.70 | 0.71 | 0.70 | 0.74 | 0.81 | 0.71 |
| 3 | 0.75 | 0.84 | 1.00 | 0.74 | 0.72 | 0.72 | 0.71 | 0.73 | 0.70 | 0.71 | 0.77 | 0.69 |
| 4 | 0.75 | 0.72 | 0.74 | 1.00 | 0.79 | 0.70 | 0.75 | 0.74 | 0.76 | 0.72 | 0.67 | 0.71 |
| 5 | 0.71 | 0.69 | 0.72 | 0.79 | 1.00 | 0.72 | 0.73 | 0.73 | 0.76 | 0.70 | 0.67 | 0.69 |
| 6 | 0.70 | 0.71 | 0.72 | 0.70 | 0.72 | 1.00 | 0.71 | 0.68 | 0.75 | 0.69 | 0.70 | 0.77 |
| 7 | 0.73 | 0.70 | 0.71 | 0.75 | 0.73 | 0.71 | 1.00 | 0.78 | 0.72 | 0.73 | 0.73 | 0.68 |
| 8 | 0.73 | 0.71 | 0.73 | 0.74 | 0.73 | 0.68 | 0.78 | 1.00 | 0.69 | 0.73 | 0.74 | 0.68 |
| 9 | 0.72 | 0.70 | 0.70 | 0.76 | 0.76 | 0.75 | 0.72 | 0.69 | 1.00 | 0.73 | 0.69 | 0.70 |
| 10 | 0.80 | 0.74 | 0.71 | 0.72 | 0.70 | 0.69 | 0.73 | 0.73 | 0.73 | 1.00 | 0.77 | 0.72 |
| 11 | 0.77 | 0.81 | 0.77 | 0.67 | 0.67 | 0.70 | 0.73 | 0.74 | 0.69 | 0.77 | 1.00 | 0.68 |
| 12 | 0.69 | 0.71 | 0.69 | 0.71 | 0.69 | 0.77 | 0.68 | 0.68 | 0.70 | 0.72 | 0.68 | 1.00 |
The table contains GDT_TS values (calculated on the Cα atoms) between the predicted models.
Read more about the global distance test (GDT, also written as GDT_TS to represent "total score") measure.
© Laboratory of Theory of Biopolymers, Faculty of Chemistry, University of Warsaw 2013