Status: Done started: 2018-Oct-06 13:30:35 UTC
| Project Name | |
| Sequence | APVRSLNCTL RDSQQKSLVM SGPYELKALH LQGQDMEQQV VFSMSFVQGE ESNDKIPVAL GLKEKNLYLS CVLKDDKPTL QLESVDPKNY PKKKMEKRFV FNKIEINNKL EFESAQFPNW YISTSQAENM PVFLGGTKGG QDITDFTMQF VSS |
| Secondary structure | CCCEEEEECC EECCCCEEEE CCCCCEEEEC CCCCCCCCCC CEEEEECCCC CCCCCCEEEE EECCCCEEEE EEEECCEEEE EEEECCCCCC CCCCCCCCCE EEEEECCCCE EEEECCCCCC EEECCCCCCE ECEEECCCCC CCCCCEECCC CCC |
| Movie from predicted structures | To download the movie, right click on the desired file format:  
|
| Estimated finish time | 2018-Oct-06 18:09 UTC |
| Project Name |
| Project Name |
| Cluster # | 1 | 2 | 3 | 4 | 5 | 6 | 7 | 8 | 9 | 10 | 11 | 12 |
| Cluster density | 145.5 | 140.8 | 137.1 | 135.0 | 122.9 | 93.9 | 87.4 | 86.9 | 83.4 | 67.2 | 58.8 | 48.4 |
| Cluster size | 241 | 249 | 225 | 220 | 208 | 149 | 145 | 150 | 132 | 120 | 90 | 71 |
| Average cluster RMSD | 1.7 | 1.8 | 1.6 | 1.6 | 1.7 | 1.6 | 1.7 | 1.7 | 1.6 | 1.8 | 1.5 | 1.5 |
| # | 1 | 2 | 3 | 4 | 5 | 6 | 7 | 8 | 9 | 10 | 11 | 12 |
| RMSD | 3.24 | 3.01 | 3.40 | 3.56 | 2.92 | 3.50 | 2.94 | 3.28 | 3.54 | 2.89 | 3.35 | 3.04 |
| GDT_TS | 0.65 | 0.69 | 0.68 | 0.67 | 0.69 | 0.67 | 0.69 | 0.65 | 0.64 | 0.67 | 0.63 | 0.69 |
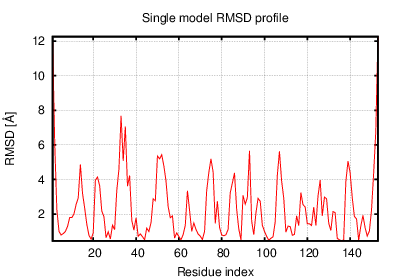
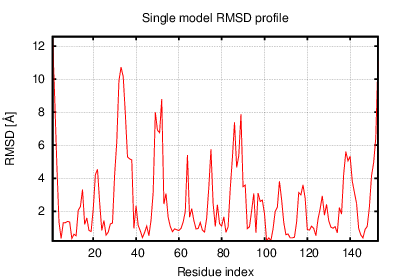
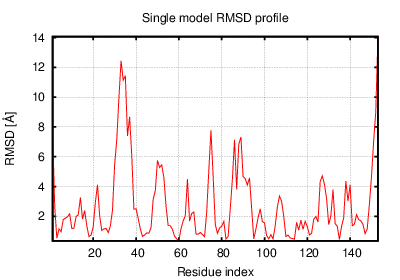
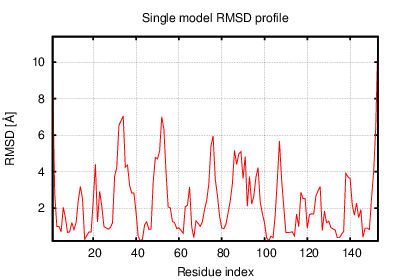
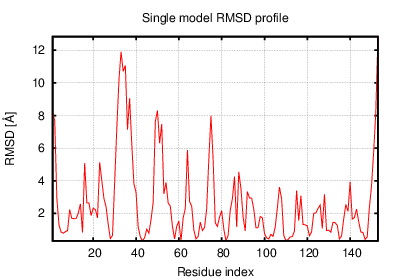
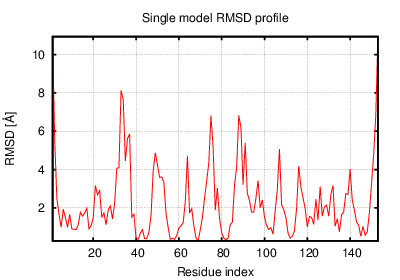
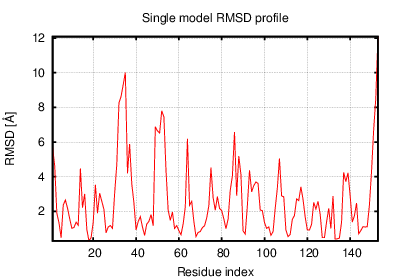
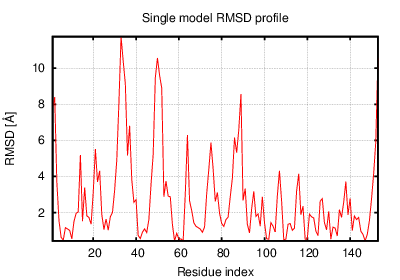
The table contains RMSD and GDT_TS values (calculated on the Cα atoms) between the predicted models and the input structure. Note that GDT_TS metric is intended as a more accurate measurement than the more common RMSD.
Read more about the root-mean-square deviation (RMSD) measure
Read more about the global distance test (GDT, also written as GDT_TS to represent "total score") measure.
| # | 1 | 2 | 3 | 4 | 5 | 6 | 7 | 8 | 9 | 10 | 11 | 12 |
| 1 | 0.00 | 2.10 | 2.24 | 1.80 | 2.17 | 2.04 | 2.10 | 2.27 | 2.41 | 2.12 | 2.09 | 2.32 |
| 2 | 2.10 | 0.00 | 2.44 | 2.21 | 1.88 | 2.36 | 2.26 | 2.21 | 2.56 | 2.28 | 2.20 | 2.10 |
| 3 | 2.24 | 2.44 | 0.00 | 2.29 | 2.17 | 2.33 | 2.26 | 2.27 | 1.92 | 2.17 | 2.28 | 2.48 |
| 4 | 1.80 | 2.21 | 2.29 | 0.00 | 2.25 | 2.19 | 2.46 | 2.08 | 2.44 | 2.29 | 2.13 | 2.64 |
| 5 | 2.17 | 1.88 | 2.17 | 2.25 | 0.00 | 2.62 | 2.15 | 2.24 | 2.56 | 1.80 | 2.18 | 2.37 |
| 6 | 2.04 | 2.36 | 2.33 | 2.19 | 2.62 | 0.00 | 2.56 | 2.22 | 2.24 | 2.43 | 2.33 | 2.28 |
| 7 | 2.10 | 2.26 | 2.26 | 2.46 | 2.15 | 2.56 | 0.00 | 2.40 | 2.61 | 2.22 | 2.24 | 2.00 |
| 8 | 2.27 | 2.21 | 2.27 | 2.08 | 2.24 | 2.22 | 2.40 | 0.00 | 2.27 | 2.31 | 2.33 | 2.37 |
| 9 | 2.41 | 2.56 | 1.92 | 2.44 | 2.56 | 2.24 | 2.61 | 2.27 | 0.00 | 2.41 | 2.62 | 2.73 |
| 10 | 2.12 | 2.28 | 2.17 | 2.29 | 1.80 | 2.43 | 2.22 | 2.31 | 2.41 | 0.00 | 2.34 | 2.25 |
| 11 | 2.09 | 2.20 | 2.28 | 2.13 | 2.18 | 2.33 | 2.24 | 2.33 | 2.62 | 2.34 | 0.00 | 2.27 |
| 12 | 2.32 | 2.10 | 2.48 | 2.64 | 2.37 | 2.28 | 2.00 | 2.37 | 2.73 | 2.25 | 2.27 | 0.00 |
The table contains RMSD values (calculated on the Cα atoms) between the predicted models.
Read more about the root-mean-square deviation (RMSD) measure.
| # | 1 | 2 | 3 | 4 | 5 | 6 | 7 | 8 | 9 | 10 | 11 | 12 |
| 1 | 1.00 | 0.75 | 0.78 | 0.81 | 0.74 | 0.77 | 0.75 | 0.74 | 0.71 | 0.75 | 0.74 | 0.76 |
| 2 | 0.75 | 1.00 | 0.73 | 0.76 | 0.80 | 0.71 | 0.74 | 0.76 | 0.70 | 0.72 | 0.73 | 0.77 |
| 3 | 0.78 | 0.73 | 1.00 | 0.76 | 0.77 | 0.74 | 0.75 | 0.76 | 0.76 | 0.78 | 0.71 | 0.75 |
| 4 | 0.81 | 0.76 | 0.76 | 1.00 | 0.72 | 0.77 | 0.72 | 0.74 | 0.70 | 0.73 | 0.74 | 0.73 |
| 5 | 0.74 | 0.80 | 0.77 | 0.72 | 1.00 | 0.71 | 0.76 | 0.74 | 0.70 | 0.79 | 0.72 | 0.75 |
| 6 | 0.77 | 0.71 | 0.74 | 0.77 | 0.71 | 1.00 | 0.70 | 0.72 | 0.73 | 0.73 | 0.69 | 0.73 |
| 7 | 0.75 | 0.74 | 0.75 | 0.72 | 0.76 | 0.70 | 1.00 | 0.73 | 0.70 | 0.74 | 0.74 | 0.78 |
| 8 | 0.74 | 0.76 | 0.76 | 0.74 | 0.74 | 0.72 | 0.73 | 1.00 | 0.71 | 0.74 | 0.70 | 0.73 |
| 9 | 0.71 | 0.70 | 0.76 | 0.70 | 0.70 | 0.73 | 0.70 | 0.71 | 1.00 | 0.72 | 0.65 | 0.67 |
| 10 | 0.75 | 0.72 | 0.78 | 0.73 | 0.79 | 0.73 | 0.74 | 0.74 | 0.72 | 1.00 | 0.68 | 0.75 |
| 11 | 0.74 | 0.73 | 0.71 | 0.74 | 0.72 | 0.69 | 0.74 | 0.70 | 0.65 | 0.68 | 1.00 | 0.77 |
| 12 | 0.76 | 0.77 | 0.75 | 0.73 | 0.75 | 0.73 | 0.78 | 0.73 | 0.67 | 0.75 | 0.77 | 1.00 |
The table contains GDT_TS values (calculated on the Cα atoms) between the predicted models.
Read more about the global distance test (GDT, also written as GDT_TS to represent "total score") measure.
© Laboratory of Theory of Biopolymers, Faculty of Chemistry, University of Warsaw 2013