Status: Done started: 2018-Sep-18 11:08:18 UTC
| Project Name | |
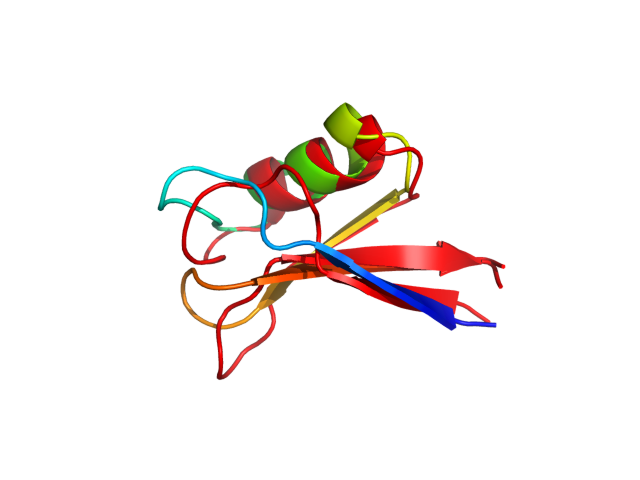
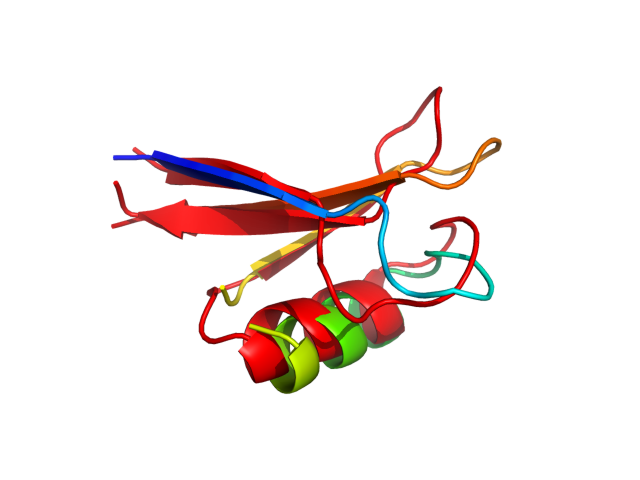
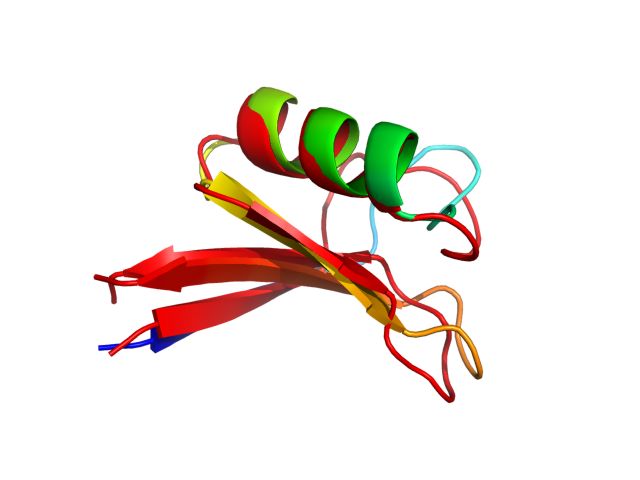
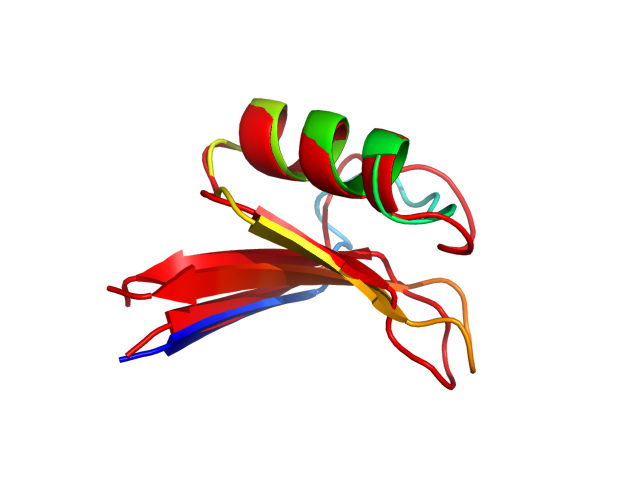
| Sequence | RECKTESNTF PGICITKPPC RKACISEKFT DGHCSKILRR CLCTKPC |
| Secondary structure | CEEEEECCCC CCCCCCHHHH HHHHHHCCCC EEEECCCCCC EEEEEEC |
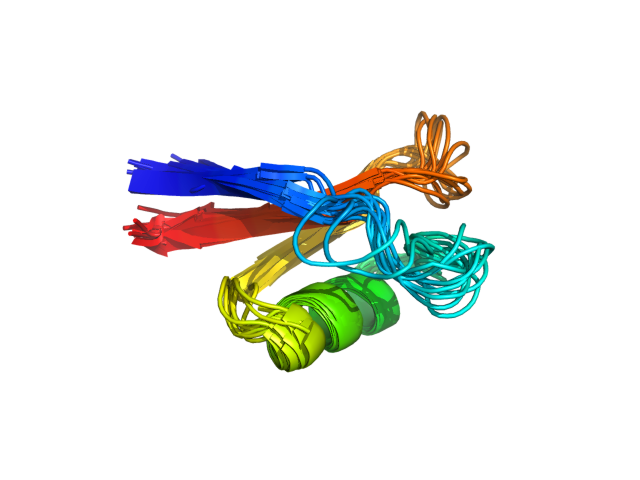
| Movie from predicted structures | To download the movie, right click on the desired file format:  
|
| Estimated finish time | 2018-Sep-18 15:33 UTC |
| Project Name |
| Project Name |
| Cluster # | 1 | 2 | 3 | 4 | 5 | 6 | 7 | 8 | 9 | 10 | 11 | 12 |
| Cluster density | 199.5 | 184.1 | 178.7 | 167.1 | 149.8 | 140.3 | 135.7 | 127.7 | 121.7 | 110.4 | 94.9 | 84.3 |
| Cluster size | 237 | 219 | 202 | 180 | 182 | 156 | 174 | 161 | 145 | 116 | 119 | 109 |
| Average cluster RMSD | 1.2 | 1.2 | 1.1 | 1.1 | 1.2 | 1.1 | 1.3 | 1.3 | 1.2 | 1.1 | 1.3 | 1.3 |
| # | 1 | 2 | 3 | 4 | 5 | 6 | 7 | 8 | 9 | 10 | 11 | 12 |
| RMSD | 2.30 | 2.41 | 2.66 | 2.12 | 2.33 | 2.07 | 2.41 | 2.50 | 2.12 | 2.39 | 2.50 | 1.97 |
| GDT_TS | 0.77 | 0.74 | 0.72 | 0.78 | 0.73 | 0.80 | 0.77 | 0.71 | 0.77 | 0.78 | 0.73 | 0.81 |
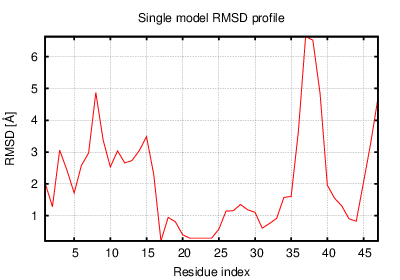
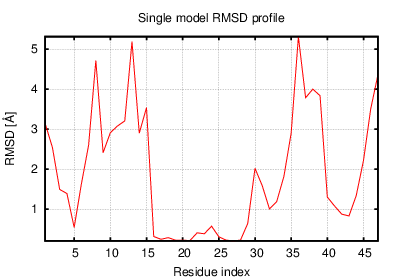
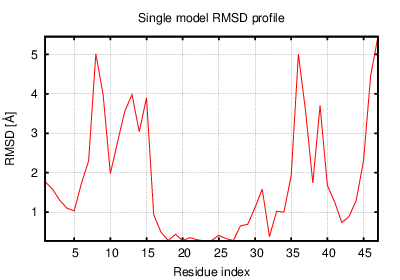
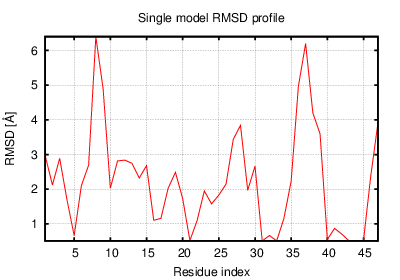
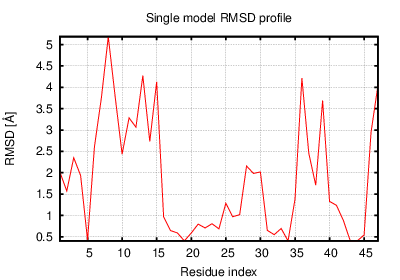
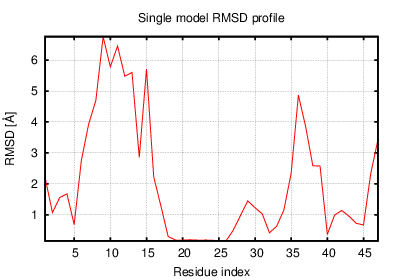
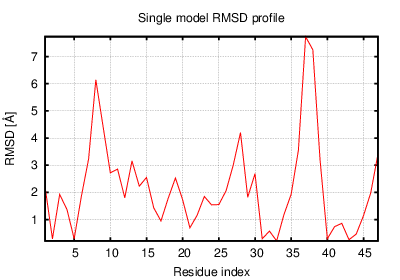
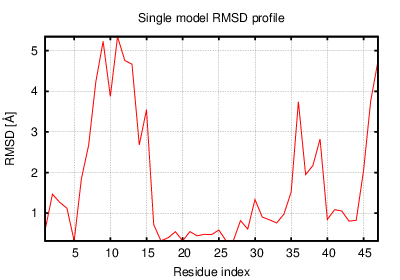
The table contains RMSD and GDT_TS values (calculated on the Cα atoms) between the predicted models and the input structure. Note that GDT_TS metric is intended as a more accurate measurement than the more common RMSD.
Read more about the root-mean-square deviation (RMSD) measure
Read more about the global distance test (GDT, also written as GDT_TS to represent "total score") measure.
| # | 1 | 2 | 3 | 4 | 5 | 6 | 7 | 8 | 9 | 10 | 11 | 12 |
| 1 | 0.00 | 1.12 | 1.42 | 1.42 | 1.07 | 1.55 | 1.20 | 1.42 | 1.54 | 2.33 | 1.09 | 1.93 |
| 2 | 1.12 | 0.00 | 1.68 | 1.37 | 1.28 | 1.45 | 1.25 | 1.33 | 1.52 | 2.61 | 1.08 | 2.17 |
| 3 | 1.42 | 1.68 | 0.00 | 2.08 | 1.39 | 1.91 | 1.72 | 1.74 | 1.88 | 2.73 | 1.40 | 2.20 |
| 4 | 1.42 | 1.37 | 2.08 | 0.00 | 1.61 | 1.07 | 1.58 | 1.50 | 1.34 | 2.34 | 1.67 | 1.79 |
| 5 | 1.07 | 1.28 | 1.39 | 1.61 | 0.00 | 1.63 | 1.42 | 1.25 | 1.43 | 2.18 | 1.14 | 1.75 |
| 6 | 1.55 | 1.45 | 1.91 | 1.07 | 1.63 | 0.00 | 1.53 | 1.50 | 1.18 | 2.44 | 1.80 | 1.82 |
| 7 | 1.20 | 1.25 | 1.72 | 1.58 | 1.42 | 1.53 | 0.00 | 1.65 | 1.62 | 2.51 | 1.51 | 2.18 |
| 8 | 1.42 | 1.33 | 1.74 | 1.50 | 1.25 | 1.50 | 1.65 | 0.00 | 1.21 | 1.96 | 1.19 | 1.61 |
| 9 | 1.54 | 1.52 | 1.88 | 1.34 | 1.43 | 1.18 | 1.62 | 1.21 | 0.00 | 2.06 | 1.64 | 1.55 |
| 10 | 2.33 | 2.61 | 2.73 | 2.34 | 2.18 | 2.44 | 2.51 | 1.96 | 2.06 | 0.00 | 2.21 | 1.19 |
| 11 | 1.09 | 1.08 | 1.40 | 1.67 | 1.14 | 1.80 | 1.51 | 1.19 | 1.64 | 2.21 | 0.00 | 1.92 |
| 12 | 1.93 | 2.17 | 2.20 | 1.79 | 1.75 | 1.82 | 2.18 | 1.61 | 1.55 | 1.19 | 1.92 | 0.00 |
The table contains RMSD values (calculated on the Cα atoms) between the predicted models.
Read more about the root-mean-square deviation (RMSD) measure.
| # | 1 | 2 | 3 | 4 | 5 | 6 | 7 | 8 | 9 | 10 | 11 | 12 |
| 1 | 1.00 | 0.93 | 0.87 | 0.91 | 0.91 | 0.89 | 0.93 | 0.87 | 0.89 | 0.81 | 0.89 | 0.85 |
| 2 | 0.93 | 1.00 | 0.84 | 0.91 | 0.88 | 0.91 | 0.89 | 0.89 | 0.88 | 0.79 | 0.93 | 0.85 |
| 3 | 0.87 | 0.84 | 1.00 | 0.80 | 0.87 | 0.83 | 0.83 | 0.89 | 0.84 | 0.75 | 0.89 | 0.82 |
| 4 | 0.91 | 0.91 | 0.80 | 1.00 | 0.84 | 0.93 | 0.90 | 0.85 | 0.89 | 0.84 | 0.87 | 0.90 |
| 5 | 0.91 | 0.88 | 0.87 | 0.84 | 1.00 | 0.85 | 0.86 | 0.89 | 0.88 | 0.83 | 0.91 | 0.85 |
| 6 | 0.89 | 0.91 | 0.83 | 0.93 | 0.85 | 1.00 | 0.88 | 0.84 | 0.89 | 0.83 | 0.84 | 0.90 |
| 7 | 0.93 | 0.89 | 0.83 | 0.90 | 0.86 | 0.88 | 1.00 | 0.85 | 0.88 | 0.82 | 0.90 | 0.84 |
| 8 | 0.87 | 0.89 | 0.89 | 0.85 | 0.89 | 0.84 | 0.85 | 1.00 | 0.90 | 0.82 | 0.93 | 0.86 |
| 9 | 0.89 | 0.88 | 0.84 | 0.89 | 0.88 | 0.89 | 0.88 | 0.90 | 1.00 | 0.87 | 0.89 | 0.90 |
| 10 | 0.81 | 0.79 | 0.75 | 0.84 | 0.83 | 0.83 | 0.82 | 0.82 | 0.87 | 1.00 | 0.82 | 0.89 |
| 11 | 0.89 | 0.93 | 0.89 | 0.87 | 0.91 | 0.84 | 0.90 | 0.93 | 0.89 | 0.82 | 1.00 | 0.87 |
| 12 | 0.85 | 0.85 | 0.82 | 0.90 | 0.85 | 0.90 | 0.84 | 0.86 | 0.90 | 0.89 | 0.87 | 1.00 |
The table contains GDT_TS values (calculated on the Cα atoms) between the predicted models.
Read more about the global distance test (GDT, also written as GDT_TS to represent "total score") measure.
© Laboratory of Theory of Biopolymers, Faculty of Chemistry, University of Warsaw 2013