Status: Done started: 2018-Oct-30 13:59:17 UTC
| Project Name | |
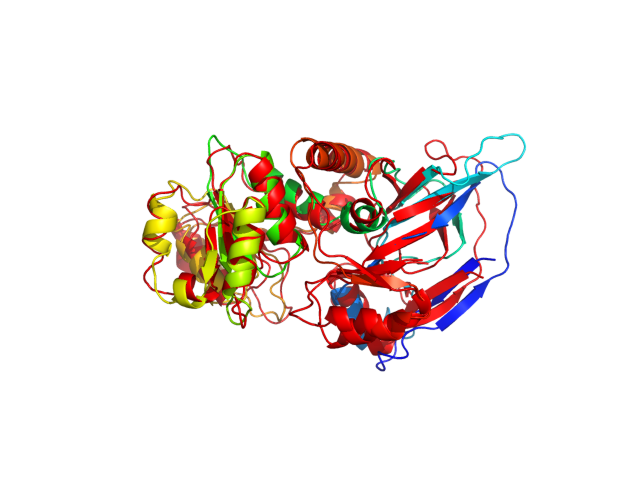
| Sequence | RVRALVYGHH GDPAKVVELK NLELAAVRGS DVRVKMLAAP INPSDINMIQ GNYGLLPELP AVGGNEGVAQ VVAVGSNVTG LKPGDWVIPA NAGLGTWRTE AVFSEEALIQ VPSDIPLQSA ATLGVNPCTA YRMLMDFEQL QPGDSVIQNA SNSGVGQAVI QIAAALGLRT INVVRDRPDI QKLSDRLKSL GAEHVITEEE LRRPEMKNFF KDMPQPRLAL NCVGGKSSTE LLRQLARGGT MVTYGGMAKQ PVVASVSLLI FKDLKLRGFW LSQWKKDHSP DQFKELILTL CDLIRRGQLT APACSQVPLQ DYQSALEASM KPFISSKQIL TM |
| Secondary structure | CEEEEEECCC CCHHHHCEEE EECCCCCCCC EEEEEEEEEE CCHHHHHHHH CCCCCCCCCC EECCCCCEEE EEEECCCCCC CCCCCEEEEC CCCCCCCCCE EEEECCCEEE ECCCCCHHHH HHHCCHHHHH HHHHHCCCCC CCCCEEEECC CCCHHHHHHH HHHHCCCCEE EEEECCCCCH HHHHHHHHCC CCCEEEEHHH HCCCCCCCCC CCCCCCCEEE ECCCHHHHHH HHHHCCCCCE EEECCCCCCC CCCCCHHHHH HCCCEEEECC HHHHHHHCCH HHHHHHHHHH HHHHHCCCCC CCCEEEEECC CHHHHHHHHH CCCCCCEEEE EC |
| Movie from predicted structures | To download the movie, right click on the desired file format:  
|
| Estimated finish time | 2018-Oct-30 18:02 UTC |
| Project Name |

| Project Name |
| Cluster # | 1 | 2 | 3 | 4 | 5 | 6 | 7 | 8 | 9 | 10 | 11 | 12 |
| Cluster density | 211.7 | 179.9 | 131.5 | 130.8 | 124.9 | 121.7 | 120.5 | 108.0 | 106.8 | 104.7 | 80.0 | 78.2 |
| Cluster size | 298 | 251 | 178 | 175 | 162 | 169 | 166 | 147 | 125 | 139 | 95 | 95 |
| Average cluster RMSD | 1.4 | 1.4 | 1.4 | 1.3 | 1.3 | 1.4 | 1.4 | 1.4 | 1.2 | 1.3 | 1.2 | 1.2 |
| # | 1 | 2 | 3 | 4 | 5 | 6 | 7 | 8 | 9 | 10 | 11 | 12 |
| RMSD | 2.92 | 3.01 | 3.23 | 3.38 | 3.31 | 3.30 | 2.65 | 3.00 | 3.37 | 3.20 | 3.14 | 3.39 |
| GDT_TS | 0.64 | 0.63 | 0.64 | 0.58 | 0.60 | 0.62 | 0.67 | 0.66 | 0.61 | 0.60 | 0.64 | 0.64 |
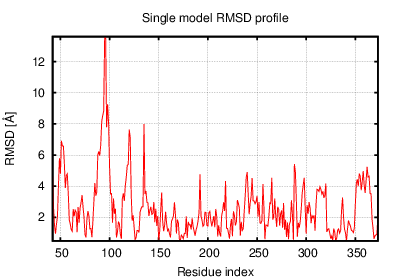
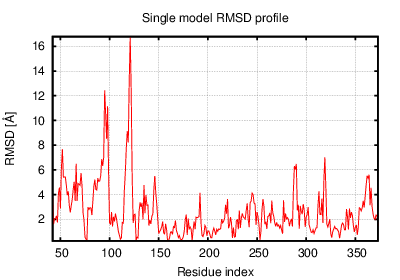
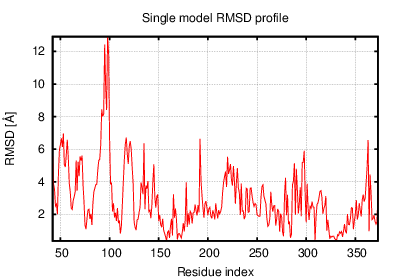
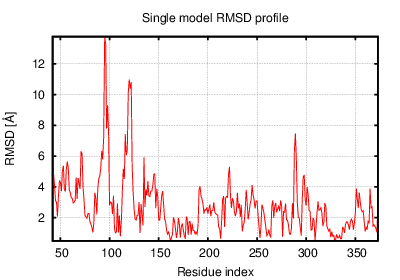
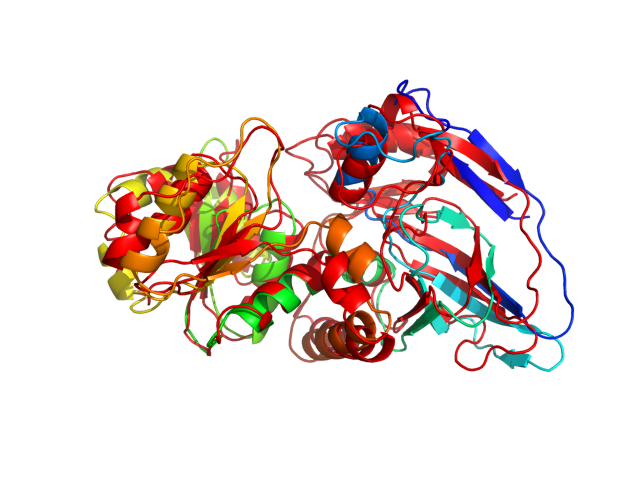
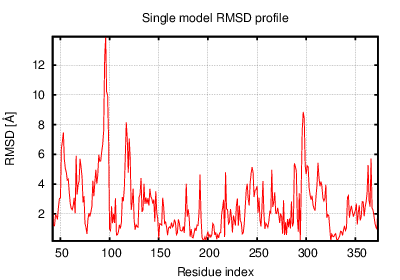
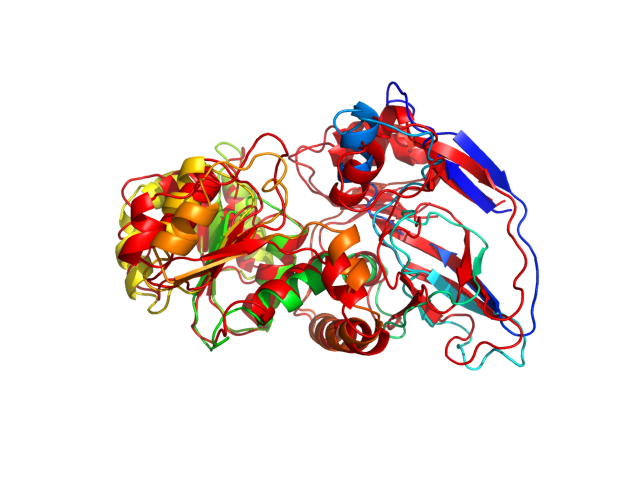
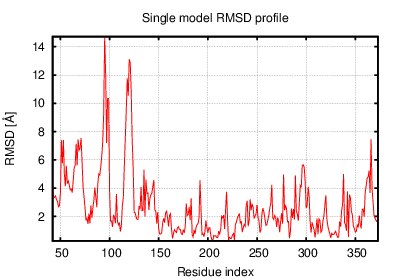
The table contains RMSD and GDT_TS values (calculated on the Cα atoms) between the predicted models and the input structure. Note that GDT_TS metric is intended as a more accurate measurement than the more common RMSD.
Read more about the root-mean-square deviation (RMSD) measure
Read more about the global distance test (GDT, also written as GDT_TS to represent "total score") measure.
| # | 1 | 2 | 3 | 4 | 5 | 6 | 7 | 8 | 9 | 10 | 11 | 12 |
| 1 | 0.00 | 2.63 | 2.30 | 3.21 | 3.01 | 2.81 | 2.49 | 2.37 | 2.33 | 2.71 | 2.56 | 2.39 |
| 2 | 2.63 | 0.00 | 2.75 | 2.06 | 1.91 | 2.19 | 3.06 | 2.44 | 2.41 | 2.42 | 2.08 | 2.61 |
| 3 | 2.30 | 2.75 | 0.00 | 3.07 | 2.88 | 2.47 | 2.83 | 2.10 | 2.37 | 2.83 | 2.63 | 2.15 |
| 4 | 3.21 | 2.06 | 3.07 | 0.00 | 1.88 | 2.30 | 3.50 | 2.79 | 2.83 | 2.54 | 2.37 | 2.80 |
| 5 | 3.01 | 1.91 | 2.88 | 1.88 | 0.00 | 2.38 | 3.35 | 2.67 | 2.52 | 2.63 | 2.31 | 2.80 |
| 6 | 2.81 | 2.19 | 2.47 | 2.30 | 2.38 | 0.00 | 3.18 | 2.27 | 2.41 | 2.32 | 2.28 | 2.18 |
| 7 | 2.49 | 3.06 | 2.83 | 3.50 | 3.35 | 3.18 | 0.00 | 2.48 | 2.84 | 3.13 | 2.87 | 2.96 |
| 8 | 2.37 | 2.44 | 2.10 | 2.79 | 2.67 | 2.27 | 2.48 | 0.00 | 2.28 | 2.46 | 2.32 | 2.04 |
| 9 | 2.33 | 2.41 | 2.37 | 2.83 | 2.52 | 2.41 | 2.84 | 2.28 | 0.00 | 2.24 | 2.18 | 2.25 |
| 10 | 2.71 | 2.42 | 2.83 | 2.54 | 2.63 | 2.32 | 3.13 | 2.46 | 2.24 | 0.00 | 2.32 | 2.43 |
| 11 | 2.56 | 2.08 | 2.63 | 2.37 | 2.31 | 2.28 | 2.87 | 2.32 | 2.18 | 2.32 | 0.00 | 2.45 |
| 12 | 2.39 | 2.61 | 2.15 | 2.80 | 2.80 | 2.18 | 2.96 | 2.04 | 2.25 | 2.43 | 2.45 | 0.00 |
The table contains RMSD values (calculated on the Cα atoms) between the predicted models.
Read more about the root-mean-square deviation (RMSD) measure.
| # | 1 | 2 | 3 | 4 | 5 | 6 | 7 | 8 | 9 | 10 | 11 | 12 |
| 1 | 1.00 | 0.66 | 0.72 | 0.60 | 0.63 | 0.66 | 0.68 | 0.70 | 0.71 | 0.66 | 0.69 | 0.70 |
| 2 | 0.66 | 1.00 | 0.65 | 0.75 | 0.76 | 0.72 | 0.61 | 0.69 | 0.71 | 0.69 | 0.74 | 0.67 |
| 3 | 0.72 | 0.65 | 1.00 | 0.62 | 0.62 | 0.68 | 0.65 | 0.74 | 0.69 | 0.66 | 0.69 | 0.71 |
| 4 | 0.60 | 0.75 | 0.62 | 1.00 | 0.76 | 0.71 | 0.58 | 0.65 | 0.68 | 0.69 | 0.71 | 0.65 |
| 5 | 0.63 | 0.76 | 0.62 | 0.76 | 1.00 | 0.70 | 0.58 | 0.67 | 0.68 | 0.66 | 0.69 | 0.63 |
| 6 | 0.66 | 0.72 | 0.68 | 0.71 | 0.70 | 1.00 | 0.62 | 0.70 | 0.71 | 0.71 | 0.72 | 0.74 |
| 7 | 0.68 | 0.61 | 0.65 | 0.58 | 0.58 | 0.62 | 1.00 | 0.70 | 0.62 | 0.61 | 0.64 | 0.65 |
| 8 | 0.70 | 0.69 | 0.74 | 0.65 | 0.67 | 0.70 | 0.70 | 1.00 | 0.71 | 0.69 | 0.73 | 0.75 |
| 9 | 0.71 | 0.71 | 0.69 | 0.68 | 0.68 | 0.71 | 0.62 | 0.71 | 1.00 | 0.72 | 0.77 | 0.71 |
| 10 | 0.66 | 0.69 | 0.66 | 0.69 | 0.66 | 0.71 | 0.61 | 0.69 | 0.72 | 1.00 | 0.73 | 0.70 |
| 11 | 0.69 | 0.74 | 0.69 | 0.71 | 0.69 | 0.72 | 0.64 | 0.73 | 0.77 | 0.73 | 1.00 | 0.72 |
| 12 | 0.70 | 0.67 | 0.71 | 0.65 | 0.63 | 0.74 | 0.65 | 0.75 | 0.71 | 0.70 | 0.72 | 1.00 |
The table contains GDT_TS values (calculated on the Cα atoms) between the predicted models.
Read more about the global distance test (GDT, also written as GDT_TS to represent "total score") measure.
© Laboratory of Theory of Biopolymers, Faculty of Chemistry, University of Warsaw 2013