Status: Done started: 2018-Nov-07 16:37:13 UTC
| Project Name | |
| Sequence | TATSVEKFLI EKFDSVSDLM QLSEGEESRA FSFDVGGRGY VLRVNSCADG FYKDRYVYRH FASAALPIPE VLDIGEFSES LTYCISRRAQ GVTLQDLPET ELPAVLQPVA EAMDAIAAAD LSQTSGFGPF GPQGIGQYTT WRDFICAIAD PHVYHWQTVM DDTVSASVAQ ALDELMLWAE DCPEVRHLVH ADFGSNNVLT DNGRITAVID WSEAMFGDSQ YEVANIFFWR PWLACMEQQT RYFERRHPES GYSSSLAGSP RLRAYMLRIG LDQLYQSLVD GNFDDAAWAQ GRCDAIVRSG AG |
| Secondary structure | CHHHHHHHHH HHHCCCEEEE EEEECCCEEE EEEEECCEEE EEEEECCCHH HHHHHHHHHH HCCCCCCCCC EEEEEECCCC CEEEEEECCC CEECCCCCCC CCCCCHHHHH HHHHHHHCCC CCCCCCEEEE CCCCCEEECC HHHHHHCCCC CCCCCHHHHC CHHHHHHHHH HHHHHHHHCC CCCCCCEEEC CCCCCCCEEE ECCEEEEECC CCCCEEECCH HHHHHHHHHC CCCHHHHHHH HHHHHCCCCC CCCCCCCCCH HHHHHHHHHH HHHHHHHHHH CCHHHHHHHH HHHHHHHHHC CC |
| Movie from predicted structures | To download the movie, right click on the desired file format:  
|
| Estimated finish time | 2018-Nov-07 20:36 UTC |
| Project Name |


| Project Name |
| Cluster # | 1 | 2 | 3 | 4 | 5 | 6 | 7 | 8 | 9 | 10 | 11 | 12 |
| Cluster density | 202.9 | 181.4 | 172.6 | 167.2 | 146.0 | 142.0 | 138.0 | 117.6 | 110.0 | 106.6 | 84.1 | 62.8 |
| Cluster size | 244 | 238 | 203 | 211 | 200 | 172 | 179 | 143 | 125 | 121 | 92 | 72 |
| Average cluster RMSD | 1.2 | 1.3 | 1.2 | 1.3 | 1.4 | 1.2 | 1.3 | 1.2 | 1.1 | 1.1 | 1.1 | 1.1 |
| # | 1 | 2 | 3 | 4 | 5 | 6 | 7 | 8 | 9 | 10 | 11 | 12 |
| RMSD | 3.74 | 3.70 | 3.73 | 3.57 | 3.62 | 3.70 | 3.06 | 3.47 | 3.65 | 3.81 | 3.40 | 3.20 |
| GDT_TS | 0.58 | 0.60 | 0.56 | 0.61 | 0.62 | 0.59 | 0.66 | 0.60 | 0.60 | 0.57 | 0.60 | 0.62 |
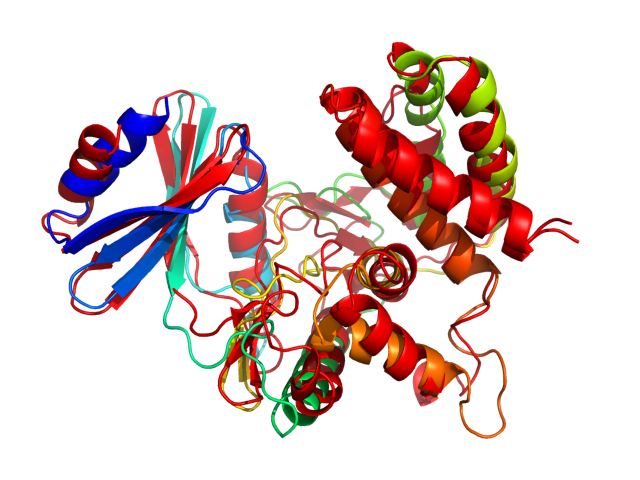
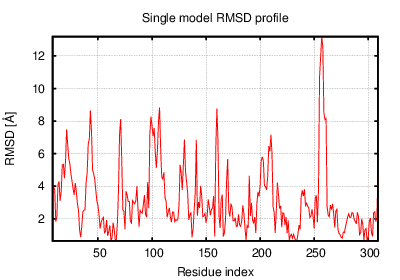
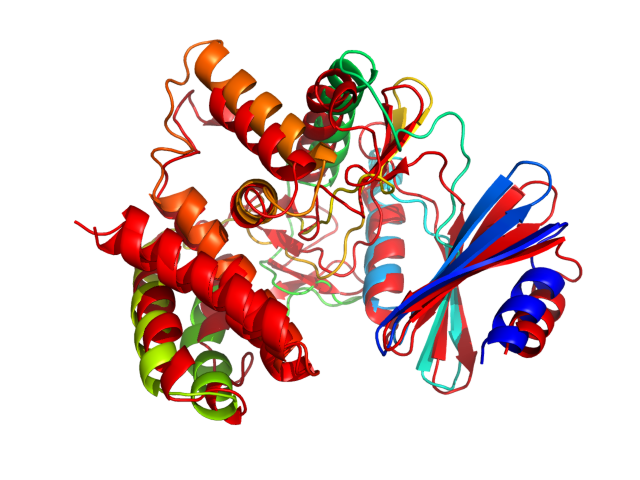
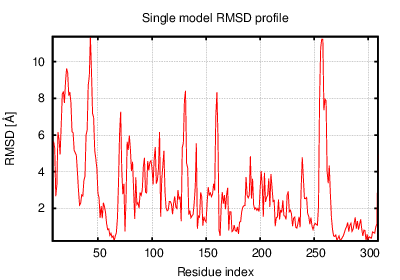
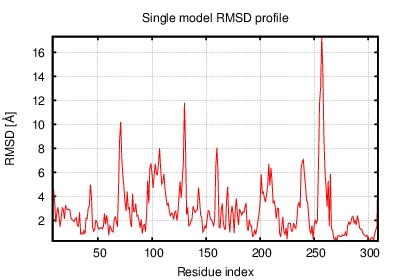
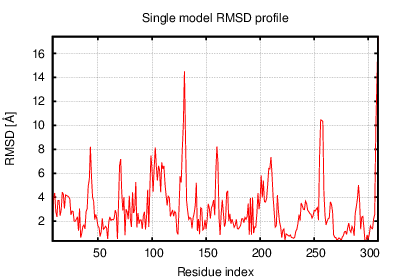
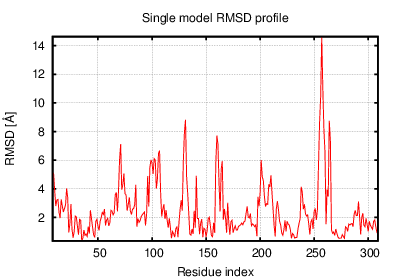
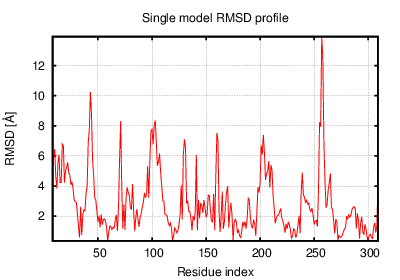
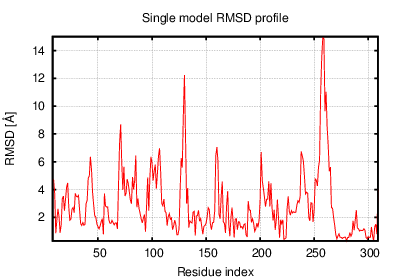
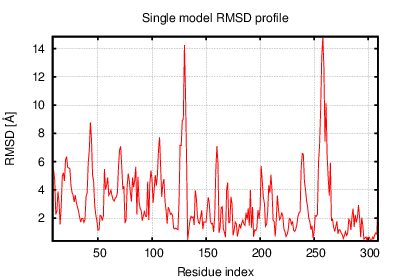
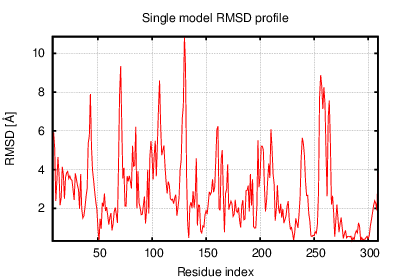
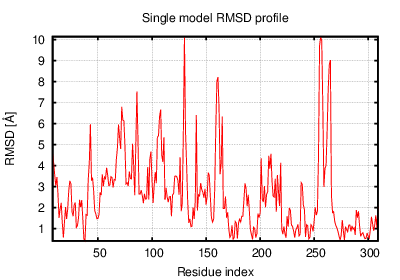
The table contains RMSD and GDT_TS values (calculated on the Cα atoms) between the predicted models and the input structure. Note that GDT_TS metric is intended as a more accurate measurement than the more common RMSD.
Read more about the root-mean-square deviation (RMSD) measure
Read more about the global distance test (GDT, also written as GDT_TS to represent "total score") measure.
| # | 1 | 2 | 3 | 4 | 5 | 6 | 7 | 8 | 9 | 10 | 11 | 12 |
| 1 | 0.00 | 2.54 | 2.37 | 2.60 | 2.54 | 2.84 | 2.75 | 2.27 | 2.91 | 3.04 | 2.61 | 3.10 |
| 2 | 2.54 | 0.00 | 2.36 | 2.33 | 2.21 | 2.63 | 2.55 | 2.32 | 2.87 | 2.76 | 1.84 | 3.06 |
| 3 | 2.37 | 2.36 | 0.00 | 2.32 | 2.26 | 2.47 | 2.97 | 1.97 | 2.90 | 2.89 | 2.38 | 3.48 |
| 4 | 2.60 | 2.33 | 2.32 | 0.00 | 2.45 | 2.54 | 3.16 | 2.39 | 3.03 | 2.90 | 2.09 | 3.37 |
| 5 | 2.54 | 2.21 | 2.26 | 2.45 | 0.00 | 2.60 | 2.62 | 2.37 | 2.60 | 2.63 | 2.13 | 3.04 |
| 6 | 2.84 | 2.63 | 2.47 | 2.54 | 2.60 | 0.00 | 3.21 | 2.40 | 2.87 | 2.81 | 2.52 | 3.45 |
| 7 | 2.75 | 2.55 | 2.97 | 3.16 | 2.62 | 3.21 | 0.00 | 2.55 | 2.72 | 3.11 | 2.69 | 2.30 |
| 8 | 2.27 | 2.32 | 1.97 | 2.39 | 2.37 | 2.40 | 2.55 | 0.00 | 2.64 | 2.79 | 2.35 | 3.14 |
| 9 | 2.91 | 2.87 | 2.90 | 3.03 | 2.60 | 2.87 | 2.72 | 2.64 | 0.00 | 1.78 | 2.71 | 3.16 |
| 10 | 3.04 | 2.76 | 2.89 | 2.90 | 2.63 | 2.81 | 3.11 | 2.79 | 1.78 | 0.00 | 2.65 | 3.35 |
| 11 | 2.61 | 1.84 | 2.38 | 2.09 | 2.13 | 2.52 | 2.69 | 2.35 | 2.71 | 2.65 | 0.00 | 3.00 |
| 12 | 3.10 | 3.06 | 3.48 | 3.37 | 3.04 | 3.45 | 2.30 | 3.14 | 3.16 | 3.35 | 3.00 | 0.00 |
The table contains RMSD values (calculated on the Cα atoms) between the predicted models.
Read more about the root-mean-square deviation (RMSD) measure.
| # | 1 | 2 | 3 | 4 | 5 | 6 | 7 | 8 | 9 | 10 | 11 | 12 |
| 1 | 1.00 | 0.68 | 0.70 | 0.69 | 0.71 | 0.69 | 0.65 | 0.72 | 0.69 | 0.68 | 0.68 | 0.59 |
| 2 | 0.68 | 1.00 | 0.71 | 0.71 | 0.72 | 0.69 | 0.66 | 0.69 | 0.70 | 0.74 | 0.79 | 0.61 |
| 3 | 0.70 | 0.71 | 1.00 | 0.69 | 0.69 | 0.72 | 0.63 | 0.76 | 0.66 | 0.67 | 0.68 | 0.57 |
| 4 | 0.69 | 0.71 | 0.69 | 1.00 | 0.69 | 0.69 | 0.62 | 0.70 | 0.70 | 0.72 | 0.73 | 0.62 |
| 5 | 0.71 | 0.72 | 0.69 | 0.69 | 1.00 | 0.71 | 0.67 | 0.69 | 0.76 | 0.74 | 0.76 | 0.63 |
| 6 | 0.69 | 0.69 | 0.72 | 0.69 | 0.71 | 1.00 | 0.63 | 0.72 | 0.69 | 0.68 | 0.72 | 0.59 |
| 7 | 0.65 | 0.66 | 0.63 | 0.62 | 0.67 | 0.63 | 1.00 | 0.65 | 0.68 | 0.64 | 0.65 | 0.70 |
| 8 | 0.72 | 0.69 | 0.76 | 0.70 | 0.69 | 0.72 | 0.65 | 1.00 | 0.67 | 0.68 | 0.68 | 0.59 |
| 9 | 0.69 | 0.70 | 0.66 | 0.70 | 0.76 | 0.69 | 0.68 | 0.67 | 1.00 | 0.78 | 0.76 | 0.64 |
| 10 | 0.68 | 0.74 | 0.67 | 0.72 | 0.74 | 0.68 | 0.64 | 0.68 | 0.78 | 1.00 | 0.75 | 0.63 |
| 11 | 0.68 | 0.79 | 0.68 | 0.73 | 0.76 | 0.72 | 0.65 | 0.68 | 0.76 | 0.75 | 1.00 | 0.62 |
| 12 | 0.59 | 0.61 | 0.57 | 0.62 | 0.63 | 0.59 | 0.70 | 0.59 | 0.64 | 0.63 | 0.62 | 1.00 |
The table contains GDT_TS values (calculated on the Cα atoms) between the predicted models.
Read more about the global distance test (GDT, also written as GDT_TS to represent "total score") measure.
© Laboratory of Theory of Biopolymers, Faculty of Chemistry, University of Warsaw 2013