Status: Done started: 2018-May-11 06:36:32 UTC
| Project Name | Vs10 |
| Sequence | MSVADYLSSD SDSGAESSGC LVLRSRKIKK GKKAASKKRS WKNERYGADE SGEDNIEWGD EVDLEMDDCD SAIPEWARVD FNPKNRRDRE DDGQSDLSRF SEDFGKKSLD VQS |
| Secondary structure | CCCCCCCCCH HHHHHHHCCC EEEEECCCCC CCEEEECCCC CCCCCCCCCE ECCCCCEECC CCCCCCCCCE EECCCHHHHH HHHHCCHHHH CCCHHHHHHH HCCCCCCEEE CCC |
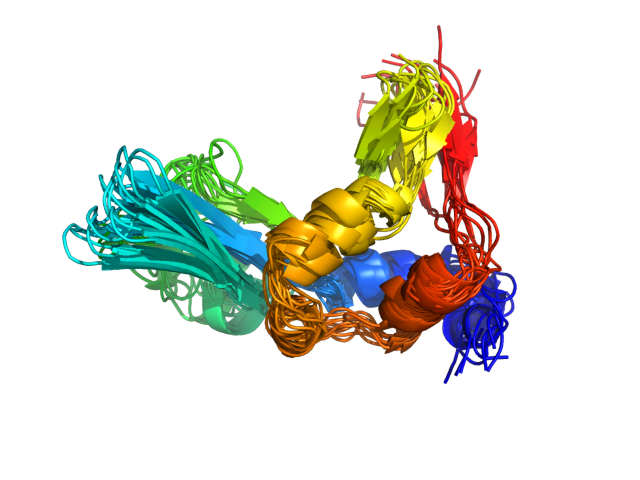
| Movie from predicted structures | To download the movie, right click on the desired file format:  
|
| Estimated finish time | 2018-May-11 11:10 UTC |
| Project Name | Vs10 |


| Project Name | Vs10 |
| Cluster # | 1 | 2 | 3 | 4 | 5 | 6 | 7 | 8 | 9 | 10 | 11 | 12 |
| Cluster density | 124.0 | 116.0 | 115.6 | 107.6 | 96.5 | 88.1 | 77.6 | 74.6 | 71.2 | 67.8 | 33.5 | 30.7 |
| Cluster size | 246 | 252 | 236 | 206 | 188 | 163 | 146 | 157 | 158 | 138 | 62 | 48 |
| Average cluster RMSD | 2.0 | 2.2 | 2.0 | 1.9 | 1.9 | 1.8 | 1.9 | 2.1 | 2.2 | 2.0 | 1.9 | 1.6 |
| # | 1 | 2 | 3 | 4 | 5 | 6 | 7 | 8 | 9 | 10 | 11 | 12 |
| RMSD | 5.18 | 4.29 | 5.31 | 4.90 | 4.72 | 4.16 | 4.36 | 4.93 | 4.49 | 4.72 | 4.36 | 4.73 |
| GDT_TS | 0.49 | 0.51 | 0.49 | 0.50 | 0.51 | 0.51 | 0.51 | 0.50 | 0.49 | 0.51 | 0.53 | 0.51 |
The table contains RMSD and GDT_TS values (calculated on the Cα atoms) between the predicted models and the input structure. Note that GDT_TS metric is intended as a more accurate measurement than the more common RMSD.
Read more about the root-mean-square deviation (RMSD) measure
Read more about the global distance test (GDT, also written as GDT_TS to represent "total score") measure.
| # | 1 | 2 | 3 | 4 | 5 | 6 | 7 | 8 | 9 | 10 | 11 | 12 |
| 1 | 0.00 | 3.43 | 1.88 | 2.33 | 2.96 | 5.24 | 2.58 | 2.62 | 2.70 | 2.55 | 3.03 | 5.03 |
| 2 | 3.43 | 0.00 | 3.31 | 3.62 | 2.64 | 3.74 | 2.97 | 3.50 | 3.00 | 3.48 | 3.84 | 3.57 |
| 3 | 1.88 | 3.31 | 0.00 | 2.48 | 2.80 | 5.37 | 2.62 | 2.78 | 2.97 | 2.78 | 2.96 | 5.29 |
| 4 | 2.33 | 3.62 | 2.48 | 0.00 | 2.98 | 5.54 | 2.28 | 2.72 | 2.86 | 2.27 | 3.08 | 5.45 |
| 5 | 2.96 | 2.64 | 2.80 | 2.98 | 0.00 | 4.63 | 2.51 | 3.47 | 2.97 | 3.35 | 3.42 | 4.44 |
| 6 | 5.24 | 3.74 | 5.37 | 5.54 | 4.63 | 0.00 | 4.74 | 4.67 | 4.09 | 5.05 | 4.99 | 3.04 |
| 7 | 2.58 | 2.97 | 2.62 | 2.28 | 2.51 | 4.74 | 0.00 | 2.86 | 2.57 | 2.53 | 2.93 | 4.88 |
| 8 | 2.62 | 3.50 | 2.78 | 2.72 | 3.47 | 4.67 | 2.86 | 0.00 | 2.68 | 2.32 | 3.38 | 4.99 |
| 9 | 2.70 | 3.00 | 2.97 | 2.86 | 2.97 | 4.09 | 2.57 | 2.68 | 0.00 | 2.59 | 3.27 | 4.09 |
| 10 | 2.55 | 3.48 | 2.78 | 2.27 | 3.35 | 5.05 | 2.53 | 2.32 | 2.59 | 0.00 | 2.79 | 5.06 |
| 11 | 3.03 | 3.84 | 2.96 | 3.08 | 3.42 | 4.99 | 2.93 | 3.38 | 3.27 | 2.79 | 0.00 | 5.22 |
| 12 | 5.03 | 3.57 | 5.29 | 5.45 | 4.44 | 3.04 | 4.88 | 4.99 | 4.09 | 5.06 | 5.22 | 0.00 |
The table contains RMSD values (calculated on the Cα atoms) between the predicted models.
Read more about the root-mean-square deviation (RMSD) measure.
| # | 1 | 2 | 3 | 4 | 5 | 6 | 7 | 8 | 9 | 10 | 11 | 12 |
| 1 | 1.00 | 0.63 | 0.79 | 0.72 | 0.64 | 0.52 | 0.68 | 0.66 | 0.67 | 0.71 | 0.61 | 0.55 |
| 2 | 0.63 | 1.00 | 0.64 | 0.59 | 0.68 | 0.59 | 0.64 | 0.59 | 0.67 | 0.61 | 0.56 | 0.65 |
| 3 | 0.79 | 0.64 | 1.00 | 0.70 | 0.66 | 0.53 | 0.71 | 0.67 | 0.68 | 0.67 | 0.61 | 0.56 |
| 4 | 0.72 | 0.59 | 0.70 | 1.00 | 0.67 | 0.52 | 0.73 | 0.67 | 0.65 | 0.72 | 0.62 | 0.56 |
| 5 | 0.64 | 0.68 | 0.66 | 0.67 | 1.00 | 0.57 | 0.69 | 0.59 | 0.66 | 0.61 | 0.65 | 0.58 |
| 6 | 0.52 | 0.59 | 0.53 | 0.52 | 0.57 | 1.00 | 0.54 | 0.54 | 0.60 | 0.53 | 0.51 | 0.65 |
| 7 | 0.68 | 0.64 | 0.71 | 0.73 | 0.69 | 0.54 | 1.00 | 0.63 | 0.71 | 0.68 | 0.64 | 0.54 |
| 8 | 0.66 | 0.59 | 0.67 | 0.67 | 0.59 | 0.54 | 0.63 | 1.00 | 0.67 | 0.73 | 0.57 | 0.54 |
| 9 | 0.67 | 0.67 | 0.68 | 0.65 | 0.66 | 0.60 | 0.71 | 0.67 | 1.00 | 0.67 | 0.60 | 0.59 |
| 10 | 0.71 | 0.61 | 0.67 | 0.72 | 0.61 | 0.53 | 0.68 | 0.73 | 0.67 | 1.00 | 0.65 | 0.54 |
| 11 | 0.61 | 0.56 | 0.61 | 0.62 | 0.65 | 0.51 | 0.64 | 0.57 | 0.60 | 0.65 | 1.00 | 0.53 |
| 12 | 0.55 | 0.65 | 0.56 | 0.56 | 0.58 | 0.65 | 0.54 | 0.54 | 0.59 | 0.54 | 0.53 | 1.00 |
The table contains GDT_TS values (calculated on the Cα atoms) between the predicted models.
Read more about the global distance test (GDT, also written as GDT_TS to represent "total score") measure.
© Laboratory of Theory of Biopolymers, Faculty of Chemistry, University of Warsaw 2013