Status: Done started: 2018-May-04 09:42:26 UTC
| Project Name | 718 |
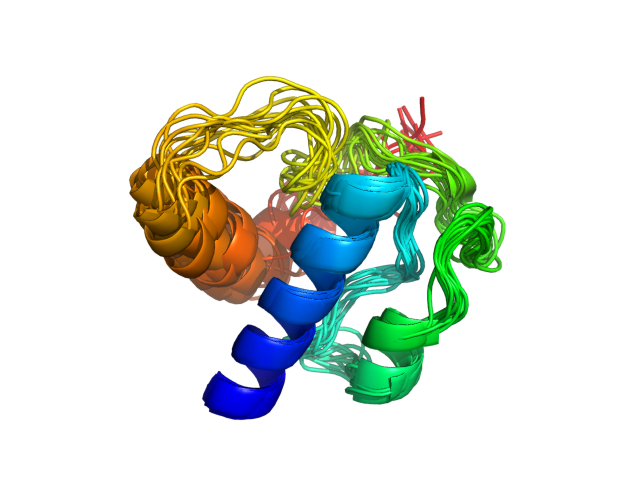
| Sequence | MPKLKSVIAG LAISTALTGG VVSAGAATTA ASATTQFSTG TSLRTDDGWG WGRRHHHHHR HHNHRCGRGH HHGGGWGWG |
| Secondary structure | CHHHHHHHHH HHHHHCCCCC CCCCCHHHHC CCCCCCCCCC CCCCCCCCCC CCCCCCCCHH HHHHHCCCCC CCCCCCCCC |
| Movie from predicted structures | To download the movie, right click on the desired file format:  
|
| Estimated finish time | 2018-May-04 14:11 UTC |
| Project Name | 718 |


| Project Name | 718 |
| Cluster # | 1 | 2 | 3 | 4 | 5 | 6 | 7 | 8 | 9 | 10 | 11 | 12 |
| Cluster density | 171.3 | 126.1 | 120.2 | 118.9 | 118.8 | 106.5 | 99.9 | 99.9 | 88.6 | 87.2 | 82.4 | 55.4 |
| Cluster size | 274 | 207 | 192 | 192 | 170 | 161 | 160 | 158 | 139 | 130 | 122 | 95 |
| Average cluster RMSD | 1.6 | 1.6 | 1.6 | 1.6 | 1.4 | 1.5 | 1.6 | 1.6 | 1.6 | 1.5 | 1.5 | 1.7 |
| # | 1 | 2 | 3 | 4 | 5 | 6 | 7 | 8 | 9 | 10 | 11 | 12 |
| RMSD | 2.52 | 2.16 | 2.82 | 2.33 | 2.39 | 2.60 | 2.40 | 2.57 | 2.20 | 2.57 | 2.65 | 2.66 |
| GDT_TS | 0.69 | 0.74 | 0.66 | 0.70 | 0.71 | 0.68 | 0.71 | 0.69 | 0.72 | 0.68 | 0.67 | 0.69 |
The table contains RMSD and GDT_TS values (calculated on the Cα atoms) between the predicted models and the input structure. Note that GDT_TS metric is intended as a more accurate measurement than the more common RMSD.
Read more about the root-mean-square deviation (RMSD) measure
Read more about the global distance test (GDT, also written as GDT_TS to represent "total score") measure.
| # | 1 | 2 | 3 | 4 | 5 | 6 | 7 | 8 | 9 | 10 | 11 | 12 |
| 1 | 0.00 | 1.63 | 2.35 | 1.78 | 1.96 | 2.29 | 1.91 | 1.70 | 1.54 | 2.19 | 2.00 | 2.31 |
| 2 | 1.63 | 0.00 | 2.41 | 1.65 | 2.05 | 1.95 | 1.38 | 1.90 | 1.80 | 1.96 | 2.14 | 1.76 |
| 3 | 2.35 | 2.41 | 0.00 | 2.44 | 2.64 | 2.48 | 2.24 | 2.44 | 2.47 | 2.52 | 2.80 | 2.70 |
| 4 | 1.78 | 1.65 | 2.44 | 0.00 | 1.91 | 2.27 | 1.86 | 2.04 | 1.92 | 2.18 | 1.91 | 2.07 |
| 5 | 1.96 | 2.05 | 2.64 | 1.91 | 0.00 | 2.62 | 2.16 | 2.18 | 1.92 | 2.49 | 1.53 | 2.52 |
| 6 | 2.29 | 1.95 | 2.48 | 2.27 | 2.62 | 0.00 | 2.33 | 2.36 | 2.12 | 1.27 | 2.65 | 1.91 |
| 7 | 1.91 | 1.38 | 2.24 | 1.86 | 2.16 | 2.33 | 0.00 | 2.26 | 2.15 | 2.14 | 2.38 | 1.95 |
| 8 | 1.70 | 1.90 | 2.44 | 2.04 | 2.18 | 2.36 | 2.26 | 0.00 | 2.00 | 2.48 | 2.26 | 2.45 |
| 9 | 1.54 | 1.80 | 2.47 | 1.92 | 1.92 | 2.12 | 2.15 | 2.00 | 0.00 | 2.03 | 2.02 | 2.40 |
| 10 | 2.19 | 1.96 | 2.52 | 2.18 | 2.49 | 1.27 | 2.14 | 2.48 | 2.03 | 0.00 | 2.59 | 1.99 |
| 11 | 2.00 | 2.14 | 2.80 | 1.91 | 1.53 | 2.65 | 2.38 | 2.26 | 2.02 | 2.59 | 0.00 | 2.43 |
| 12 | 2.31 | 1.76 | 2.70 | 2.07 | 2.52 | 1.91 | 1.95 | 2.45 | 2.40 | 1.99 | 2.43 | 0.00 |
The table contains RMSD values (calculated on the Cα atoms) between the predicted models.
Read more about the root-mean-square deviation (RMSD) measure.
| # | 1 | 2 | 3 | 4 | 5 | 6 | 7 | 8 | 9 | 10 | 11 | 12 |
| 1 | 1.00 | 0.79 | 0.73 | 0.81 | 0.79 | 0.76 | 0.77 | 0.79 | 0.82 | 0.74 | 0.78 | 0.76 |
| 2 | 0.79 | 1.00 | 0.73 | 0.80 | 0.79 | 0.78 | 0.87 | 0.76 | 0.79 | 0.77 | 0.75 | 0.78 |
| 3 | 0.73 | 0.73 | 1.00 | 0.73 | 0.72 | 0.73 | 0.76 | 0.78 | 0.72 | 0.70 | 0.73 | 0.71 |
| 4 | 0.81 | 0.80 | 0.73 | 1.00 | 0.81 | 0.75 | 0.76 | 0.76 | 0.78 | 0.76 | 0.79 | 0.76 |
| 5 | 0.79 | 0.79 | 0.72 | 0.81 | 1.00 | 0.70 | 0.76 | 0.75 | 0.81 | 0.72 | 0.83 | 0.71 |
| 6 | 0.76 | 0.78 | 0.73 | 0.75 | 0.70 | 1.00 | 0.73 | 0.73 | 0.78 | 0.87 | 0.70 | 0.77 |
| 7 | 0.77 | 0.87 | 0.76 | 0.76 | 0.76 | 0.73 | 1.00 | 0.73 | 0.76 | 0.76 | 0.73 | 0.76 |
| 8 | 0.79 | 0.76 | 0.78 | 0.76 | 0.75 | 0.73 | 0.73 | 1.00 | 0.77 | 0.71 | 0.76 | 0.73 |
| 9 | 0.82 | 0.79 | 0.72 | 0.78 | 0.81 | 0.78 | 0.76 | 0.77 | 1.00 | 0.79 | 0.78 | 0.73 |
| 10 | 0.74 | 0.77 | 0.70 | 0.76 | 0.72 | 0.87 | 0.76 | 0.71 | 0.79 | 1.00 | 0.70 | 0.76 |
| 11 | 0.78 | 0.75 | 0.73 | 0.79 | 0.83 | 0.70 | 0.73 | 0.76 | 0.78 | 0.70 | 1.00 | 0.74 |
| 12 | 0.76 | 0.78 | 0.71 | 0.76 | 0.71 | 0.77 | 0.76 | 0.73 | 0.73 | 0.76 | 0.74 | 1.00 |
The table contains GDT_TS values (calculated on the Cα atoms) between the predicted models.
Read more about the global distance test (GDT, also written as GDT_TS to represent "total score") measure.
© Laboratory of Theory of Biopolymers, Faculty of Chemistry, University of Warsaw 2013