Status: Done started: 2018-Apr-26 11:16:53 UTC
| Project Name | 11 |
| Sequence | IVGGYTCAAN SIPYQVSLNS GSHFCGGSLI NSQWVVSAAH CYKSRIQVRL GEHNIDVLEG NEQFINAAKI ITDIMLIKLS SPATLNSRVA TVSLPRSCAA AGTECLISGW GNTKSSGSSY PSLLQCLKAP VLSDSSCKSS YPGQITGNMI CVGFLEGGKD SCQGDSGGPV VCNGQLQGIV SWGYGCAQKN KPGVYTKVCN YVNWIQQTIA AN |
| Secondary structure | CCCCEECCCC CCCCEEEEEC CCEEEEEEEE ECCEEECCCC CCCCCCEEEE CCCCCCCCCC CCEEEEEEEE ECCCCEEEEC CCCCCCCCCC CCCCCCCCCC CCCEEEEEEC CCCCCCCCCC CCCCEEEEEE CCCHHHHHHH CCCCCCCCEE ECCCCCCCCC CCCCCCCCEE EECCEEEEEE EECCCCCCCC CCCEEEECCC CHHHHHHHHH HC |
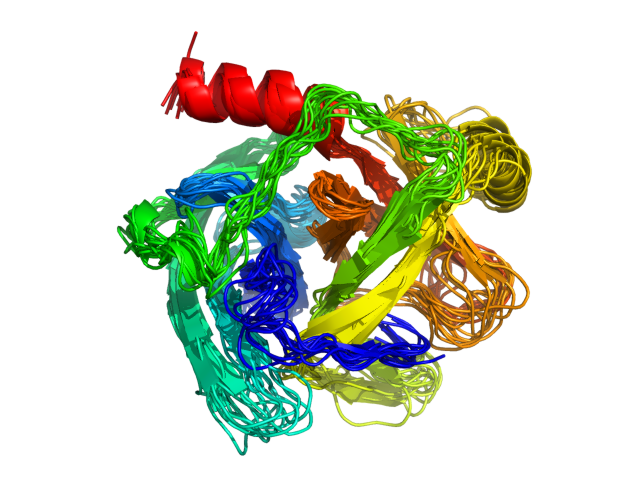
| Movie from predicted structures | To download the movie, right click on the desired file format:  
|
| Estimated finish time | 2018-Apr-26 16:03 UTC |
| Project Name | 11 |


| Project Name | 11 |
| Cluster # | 1 | 2 | 3 | 4 | 5 | 6 | 7 | 8 | 9 | 10 | 11 | 12 |
| Cluster density | 173.0 | 163.6 | 153.2 | 149.9 | 145.3 | 123.2 | 118.6 | 114.9 | 110.4 | 103.4 | 90.7 | 72.9 |
| Cluster size | 232 | 219 | 194 | 202 | 202 | 149 | 164 | 146 | 153 | 125 | 130 | 84 |
| Average cluster RMSD | 1.3 | 1.3 | 1.3 | 1.3 | 1.4 | 1.2 | 1.4 | 1.3 | 1.4 | 1.2 | 1.4 | 1.2 |
| # | 1 | 2 | 3 | 4 | 5 | 6 | 7 | 8 | 9 | 10 | 11 | 12 |
| RMSD | 2.31 | 2.65 | 2.99 | 2.18 | 2.34 | 2.87 | 2.66 | 2.56 | 2.60 | 2.62 | 2.32 | 2.85 |
| GDT_TS | 0.72 | 0.70 | 0.68 | 0.72 | 0.69 | 0.68 | 0.71 | 0.68 | 0.69 | 0.69 | 0.70 | 0.71 |
The table contains RMSD and GDT_TS values (calculated on the Cα atoms) between the predicted models and the input structure. Note that GDT_TS metric is intended as a more accurate measurement than the more common RMSD.
Read more about the root-mean-square deviation (RMSD) measure
Read more about the global distance test (GDT, also written as GDT_TS to represent "total score") measure.
| # | 1 | 2 | 3 | 4 | 5 | 6 | 7 | 8 | 9 | 10 | 11 | 12 |
| 1 | 0.00 | 2.26 | 2.49 | 2.19 | 2.52 | 2.33 | 2.16 | 1.97 | 2.25 | 1.79 | 2.55 | 2.30 |
| 2 | 2.26 | 0.00 | 2.16 | 2.30 | 2.30 | 1.97 | 1.88 | 2.09 | 2.24 | 2.52 | 2.30 | 1.99 |
| 3 | 2.49 | 2.16 | 0.00 | 2.53 | 2.74 | 2.18 | 1.98 | 2.30 | 2.34 | 2.51 | 2.71 | 2.16 |
| 4 | 2.19 | 2.30 | 2.53 | 0.00 | 2.07 | 2.37 | 2.21 | 2.23 | 2.57 | 2.57 | 2.36 | 2.52 |
| 5 | 2.52 | 2.30 | 2.74 | 2.07 | 0.00 | 2.33 | 2.31 | 2.38 | 2.57 | 2.61 | 2.13 | 2.51 |
| 6 | 2.33 | 1.97 | 2.18 | 2.37 | 2.33 | 0.00 | 1.99 | 2.31 | 2.45 | 2.66 | 2.28 | 2.15 |
| 7 | 2.16 | 1.88 | 1.98 | 2.21 | 2.31 | 1.99 | 0.00 | 1.80 | 2.28 | 2.31 | 2.40 | 1.89 |
| 8 | 1.97 | 2.09 | 2.30 | 2.23 | 2.38 | 2.31 | 1.80 | 0.00 | 2.06 | 1.91 | 2.53 | 2.18 |
| 9 | 2.25 | 2.24 | 2.34 | 2.57 | 2.57 | 2.45 | 2.28 | 2.06 | 0.00 | 2.01 | 2.65 | 2.31 |
| 10 | 1.79 | 2.52 | 2.51 | 2.57 | 2.61 | 2.66 | 2.31 | 1.91 | 2.01 | 0.00 | 2.74 | 2.47 |
| 11 | 2.55 | 2.30 | 2.71 | 2.36 | 2.13 | 2.28 | 2.40 | 2.53 | 2.65 | 2.74 | 0.00 | 2.72 |
| 12 | 2.30 | 1.99 | 2.16 | 2.52 | 2.51 | 2.15 | 1.89 | 2.18 | 2.31 | 2.47 | 2.72 | 0.00 |
The table contains RMSD values (calculated on the Cα atoms) between the predicted models.
Read more about the root-mean-square deviation (RMSD) measure.
| # | 1 | 2 | 3 | 4 | 5 | 6 | 7 | 8 | 9 | 10 | 11 | 12 |
| 1 | 1.00 | 0.71 | 0.72 | 0.74 | 0.69 | 0.71 | 0.73 | 0.74 | 0.75 | 0.79 | 0.71 | 0.73 |
| 2 | 0.71 | 1.00 | 0.71 | 0.73 | 0.72 | 0.74 | 0.77 | 0.73 | 0.70 | 0.68 | 0.75 | 0.76 |
| 3 | 0.72 | 0.71 | 1.00 | 0.71 | 0.70 | 0.74 | 0.76 | 0.74 | 0.73 | 0.72 | 0.71 | 0.76 |
| 4 | 0.74 | 0.73 | 0.71 | 1.00 | 0.78 | 0.73 | 0.75 | 0.73 | 0.68 | 0.72 | 0.73 | 0.71 |
| 5 | 0.69 | 0.72 | 0.70 | 0.78 | 1.00 | 0.71 | 0.74 | 0.68 | 0.66 | 0.67 | 0.73 | 0.70 |
| 6 | 0.71 | 0.74 | 0.74 | 0.73 | 0.71 | 1.00 | 0.76 | 0.72 | 0.71 | 0.69 | 0.75 | 0.74 |
| 7 | 0.73 | 0.77 | 0.76 | 0.75 | 0.74 | 0.76 | 1.00 | 0.80 | 0.73 | 0.74 | 0.74 | 0.78 |
| 8 | 0.74 | 0.73 | 0.74 | 0.73 | 0.68 | 0.72 | 0.80 | 1.00 | 0.77 | 0.76 | 0.73 | 0.75 |
| 9 | 0.75 | 0.70 | 0.73 | 0.68 | 0.66 | 0.71 | 0.73 | 0.77 | 1.00 | 0.77 | 0.68 | 0.73 |
| 10 | 0.79 | 0.68 | 0.72 | 0.72 | 0.67 | 0.69 | 0.74 | 0.76 | 0.77 | 1.00 | 0.67 | 0.71 |
| 11 | 0.71 | 0.75 | 0.71 | 0.73 | 0.73 | 0.75 | 0.74 | 0.73 | 0.68 | 0.67 | 1.00 | 0.74 |
| 12 | 0.73 | 0.76 | 0.76 | 0.71 | 0.70 | 0.74 | 0.78 | 0.75 | 0.73 | 0.71 | 0.74 | 1.00 |
The table contains GDT_TS values (calculated on the Cα atoms) between the predicted models.
Read more about the global distance test (GDT, also written as GDT_TS to represent "total score") measure.
© Laboratory of Theory of Biopolymers, Faculty of Chemistry, University of Warsaw 2013