Status: Done started: 2018-Jun-09 11:18:06 UTC
| Project Name | |
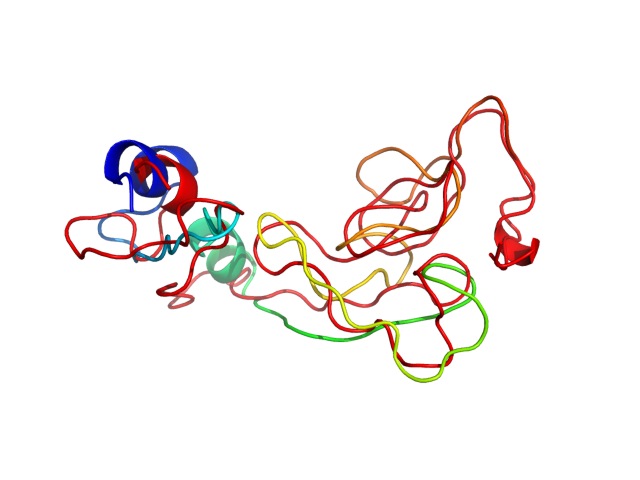
| Sequence | HFPRACVSSK NLMEKECCPP WSRDRSPCGQ LSGRGSCQNI LLSNAPLGPQ FPFTGVDDRE SWPSVFYNRT CQCSGNFMGF NCGNCKFGFW GPNCTE |
| Secondary structure | CCCCCCCCCC CCCCCCCCCC CCCCCCCCCC CCCCCCCCCC CCCCCCCCCC CCCCCCCCCC CCCCCCCCCC CCCCCCEECC CCCEECCCCC CCCCCC |
| Movie from predicted structures | To download the movie, right click on the desired file format:  
|
| Estimated finish time | 2018-Jun-09 15:49 UTC |
| Project Name |


| Project Name |
| Cluster # | 1 | 2 | 3 | 4 | 5 | 6 | 7 | 8 | 9 | 10 | 11 | 12 |
| Cluster density | 109.9 | 107.9 | 102.3 | 90.4 | 90.2 | 85.3 | 84.4 | 77.3 | 75.8 | 73.2 | 57.4 | 46.8 |
| Cluster size | 226 | 219 | 217 | 198 | 172 | 167 | 166 | 147 | 138 | 141 | 120 | 89 |
| Average cluster RMSD | 2.1 | 2.0 | 2.1 | 2.2 | 1.9 | 2.0 | 2.0 | 1.9 | 1.8 | 1.9 | 2.1 | 1.9 |
| # | 1 | 2 | 3 | 4 | 5 | 6 | 7 | 8 | 9 | 10 | 11 | 12 |
| RMSD | 5.10 | 4.97 | 6.05 | 4.81 | 4.71 | 4.03 | 6.22 | 5.01 | 6.24 | 5.77 | 7.00 | 5.11 |
| GDT_TS | 0.44 | 0.46 | 0.45 | 0.49 | 0.45 | 0.49 | 0.38 | 0.50 | 0.44 | 0.46 | 0.39 | 0.44 |
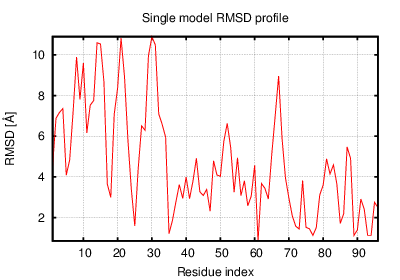
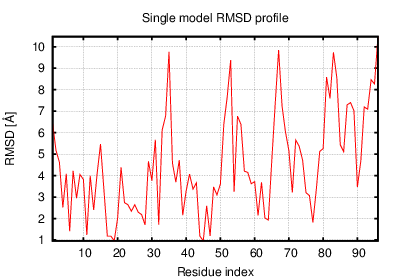
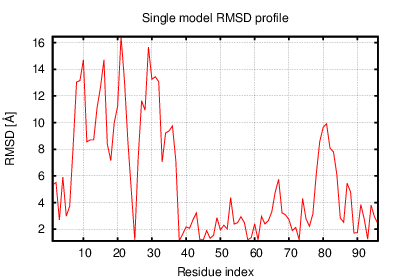
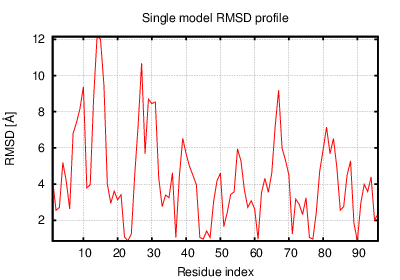
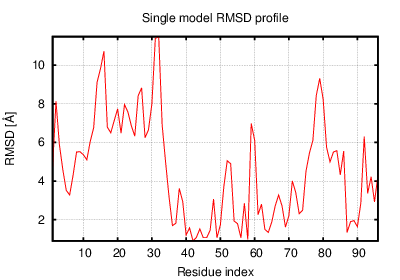
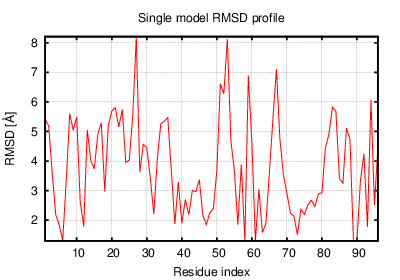
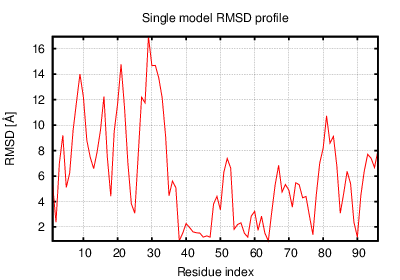
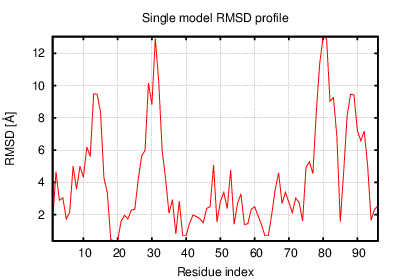
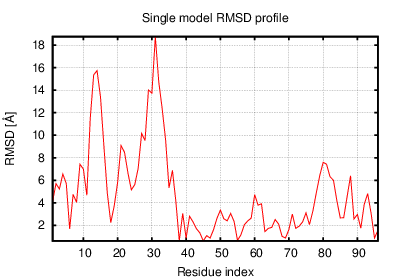
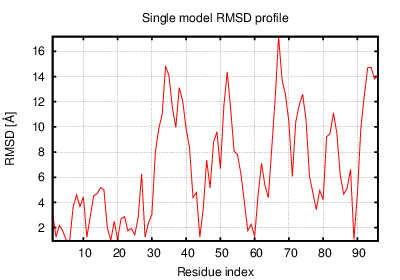
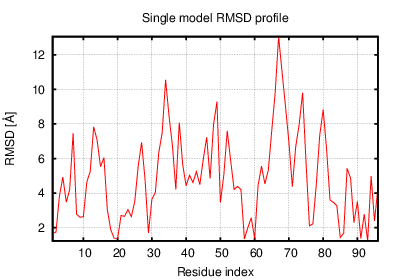
The table contains RMSD and GDT_TS values (calculated on the Cα atoms) between the predicted models and the input structure. Note that GDT_TS metric is intended as a more accurate measurement than the more common RMSD.
Read more about the root-mean-square deviation (RMSD) measure
Read more about the global distance test (GDT, also written as GDT_TS to represent "total score") measure.
| # | 1 | 2 | 3 | 4 | 5 | 6 | 7 | 8 | 9 | 10 | 11 | 12 |
| 1 | 0.00 | 4.79 | 3.59 | 3.67 | 4.88 | 4.15 | 3.45 | 6.05 | 6.99 | 6.23 | 5.64 | 5.89 |
| 2 | 4.79 | 0.00 | 5.87 | 4.46 | 5.63 | 4.09 | 5.36 | 5.33 | 7.03 | 7.29 | 4.43 | 5.24 |
| 3 | 3.59 | 5.87 | 0.00 | 4.08 | 5.90 | 5.07 | 3.04 | 5.44 | 7.34 | 5.86 | 6.29 | 6.67 |
| 4 | 3.67 | 4.46 | 4.08 | 0.00 | 5.27 | 4.07 | 4.19 | 4.88 | 6.65 | 5.60 | 5.11 | 4.76 |
| 5 | 4.88 | 5.63 | 5.90 | 5.27 | 0.00 | 4.09 | 5.71 | 5.98 | 5.59 | 5.11 | 7.82 | 5.86 |
| 6 | 4.15 | 4.09 | 5.07 | 4.07 | 4.09 | 0.00 | 5.06 | 5.19 | 6.54 | 6.33 | 6.60 | 5.51 |
| 7 | 3.45 | 5.36 | 3.04 | 4.19 | 5.71 | 5.06 | 0.00 | 6.05 | 7.66 | 6.33 | 5.78 | 6.64 |
| 8 | 6.05 | 5.33 | 5.44 | 4.88 | 5.98 | 5.19 | 6.05 | 0.00 | 6.68 | 5.80 | 7.23 | 5.80 |
| 9 | 6.99 | 7.03 | 7.34 | 6.65 | 5.59 | 6.54 | 7.66 | 6.68 | 0.00 | 6.06 | 7.89 | 5.66 |
| 10 | 6.23 | 7.29 | 5.86 | 5.60 | 5.11 | 6.33 | 6.33 | 5.80 | 6.06 | 0.00 | 8.59 | 6.20 |
| 11 | 5.64 | 4.43 | 6.29 | 5.11 | 7.82 | 6.60 | 5.78 | 7.23 | 7.89 | 8.59 | 0.00 | 5.98 |
| 12 | 5.89 | 5.24 | 6.67 | 4.76 | 5.86 | 5.51 | 6.64 | 5.80 | 5.66 | 6.20 | 5.98 | 0.00 |
The table contains RMSD values (calculated on the Cα atoms) between the predicted models.
Read more about the root-mean-square deviation (RMSD) measure.
| # | 1 | 2 | 3 | 4 | 5 | 6 | 7 | 8 | 9 | 10 | 11 | 12 |
| 1 | 1.00 | 0.50 | 0.57 | 0.57 | 0.44 | 0.53 | 0.58 | 0.43 | 0.42 | 0.46 | 0.52 | 0.40 |
| 2 | 0.50 | 1.00 | 0.46 | 0.54 | 0.54 | 0.56 | 0.47 | 0.52 | 0.48 | 0.39 | 0.49 | 0.48 |
| 3 | 0.57 | 0.46 | 1.00 | 0.54 | 0.42 | 0.48 | 0.62 | 0.50 | 0.44 | 0.49 | 0.52 | 0.43 |
| 4 | 0.57 | 0.54 | 0.54 | 1.00 | 0.43 | 0.51 | 0.55 | 0.51 | 0.51 | 0.49 | 0.50 | 0.54 |
| 5 | 0.44 | 0.54 | 0.42 | 0.43 | 1.00 | 0.60 | 0.42 | 0.48 | 0.46 | 0.52 | 0.39 | 0.43 |
| 6 | 0.53 | 0.56 | 0.48 | 0.51 | 0.60 | 1.00 | 0.47 | 0.47 | 0.45 | 0.41 | 0.40 | 0.44 |
| 7 | 0.58 | 0.47 | 0.62 | 0.55 | 0.42 | 0.47 | 1.00 | 0.45 | 0.39 | 0.43 | 0.51 | 0.39 |
| 8 | 0.43 | 0.52 | 0.50 | 0.51 | 0.48 | 0.47 | 0.45 | 1.00 | 0.50 | 0.49 | 0.43 | 0.51 |
| 9 | 0.42 | 0.48 | 0.44 | 0.51 | 0.46 | 0.45 | 0.39 | 0.50 | 1.00 | 0.44 | 0.43 | 0.49 |
| 10 | 0.46 | 0.39 | 0.49 | 0.49 | 0.52 | 0.41 | 0.43 | 0.49 | 0.44 | 1.00 | 0.42 | 0.47 |
| 11 | 0.52 | 0.49 | 0.52 | 0.50 | 0.39 | 0.40 | 0.51 | 0.43 | 0.43 | 0.42 | 1.00 | 0.47 |
| 12 | 0.40 | 0.48 | 0.43 | 0.54 | 0.43 | 0.44 | 0.39 | 0.51 | 0.49 | 0.47 | 0.47 | 1.00 |
The table contains GDT_TS values (calculated on the Cα atoms) between the predicted models.
Read more about the global distance test (GDT, also written as GDT_TS to represent "total score") measure.
© Laboratory of Theory of Biopolymers, Faculty of Chemistry, University of Warsaw 2013