Status: Done started: 2018-Oct-10 07:56:16 UTC
| Project Name | |
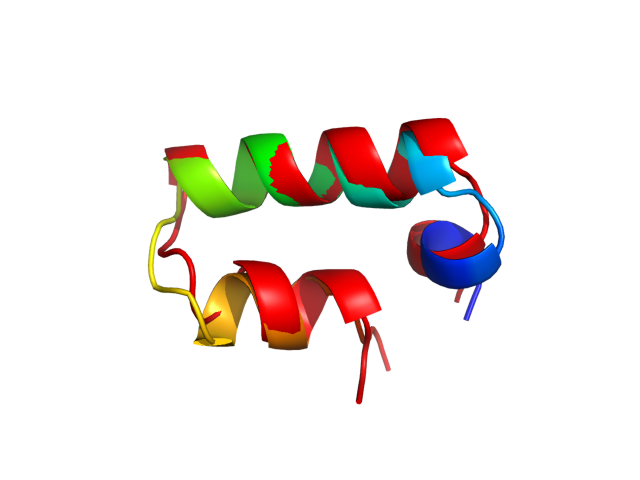
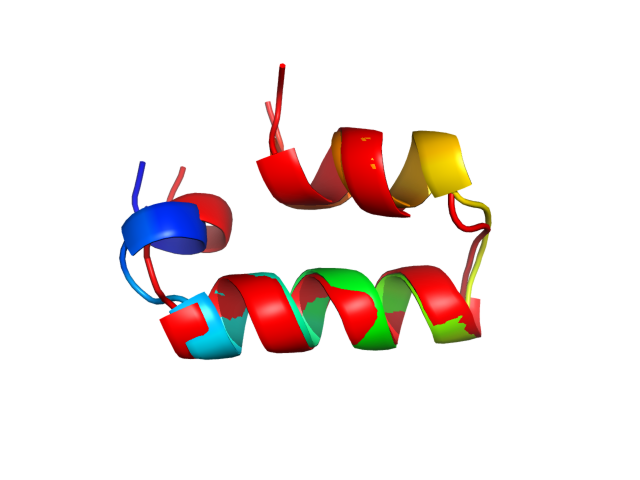
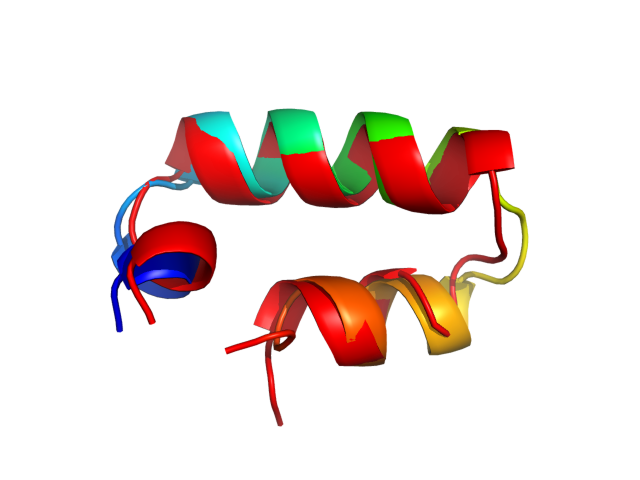
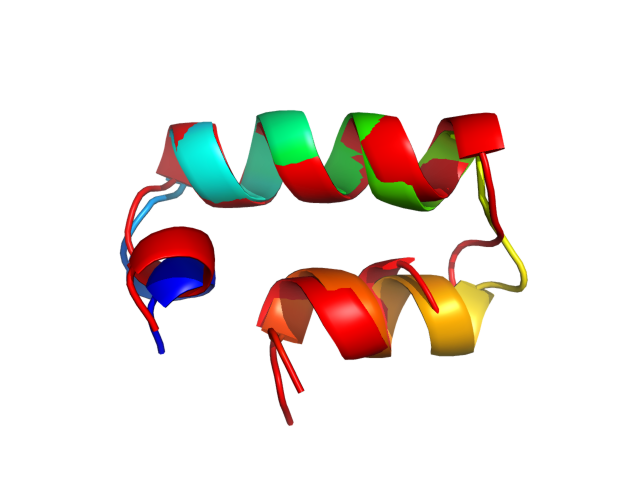
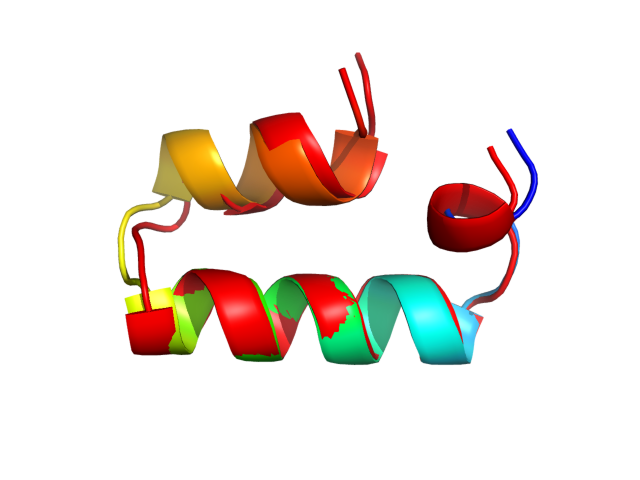
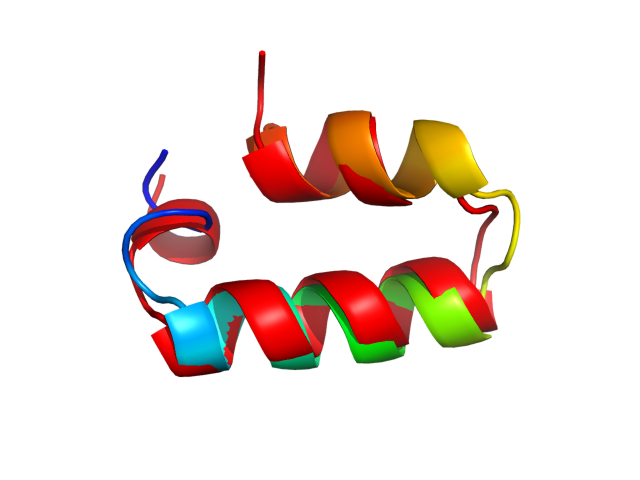
| Sequence | MNLLFGKYTI ARIKHIVLNN FSQSYTYDML FYQ |
| Secondary structure | CHHHHCHHHH HHHHHHHHHH CCHHHHHHHH HCC |
| Movie from predicted structures | To download the movie, right click on the desired file format:  
|
| Estimated finish time | 2018-Oct-10 12:19 UTC |
| Project Name |

| Project Name |
| Cluster # | 1 | 2 | 3 | 4 | 5 | 6 | 7 | 8 | 9 | 10 | 11 | 12 |
| Cluster density | 280.2 | 230.4 | 219.0 | 193.7 | 193.2 | 185.7 | 179.4 | 163.3 | 126.5 | 125.7 | 116.3 | 96.5 |
| Cluster size | 250 | 218 | 200 | 200 | 163 | 198 | 148 | 166 | 146 | 118 | 114 | 79 |
| Average cluster RMSD | 0.9 | 0.9 | 0.9 | 1.0 | 0.8 | 1.1 | 0.8 | 1.0 | 1.2 | 0.9 | 1.0 | 0.8 |
| # | 1 | 2 | 3 | 4 | 5 | 6 | 7 | 8 | 9 | 10 | 11 | 12 |
| RMSD | 1.68 | 1.95 | 1.87 | 1.55 | 1.98 | 1.37 | 2.22 | 1.64 | 2.22 | 2.10 | 1.89 | 2.62 |
| GDT_TS | 0.87 | 0.84 | 0.86 | 0.87 | 0.83 | 0.89 | 0.80 | 0.86 | 0.83 | 0.82 | 0.86 | 0.80 |
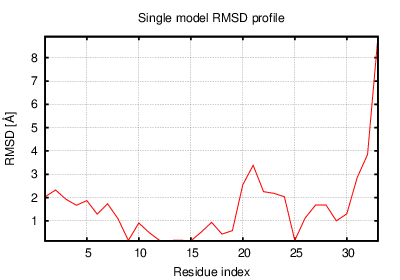
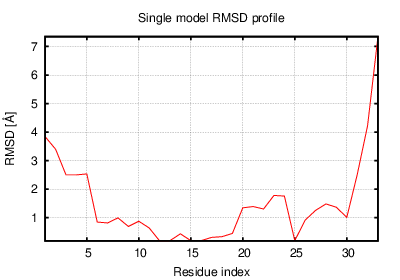
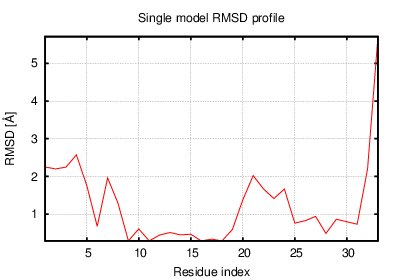
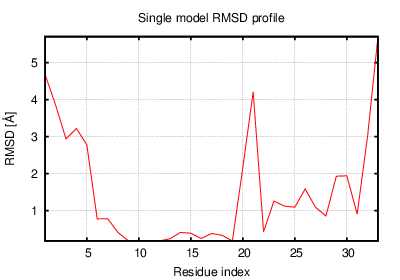
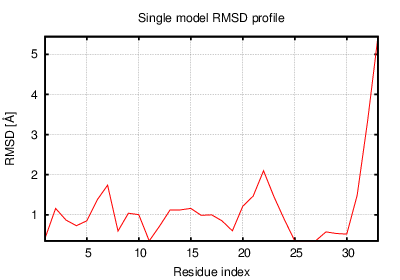
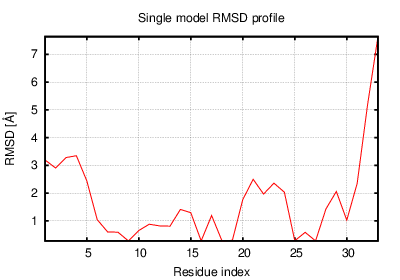
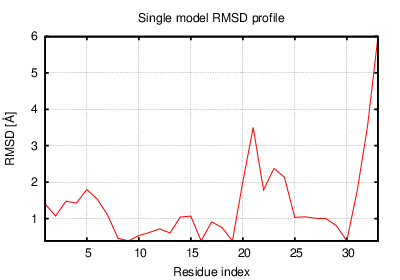
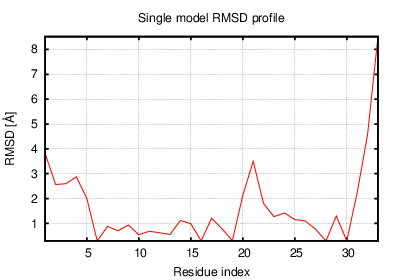
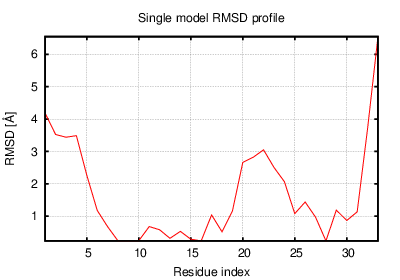
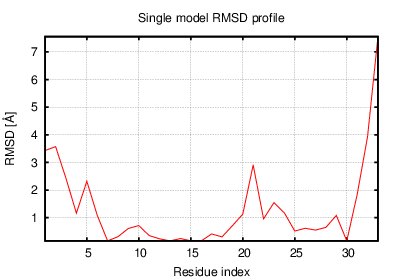
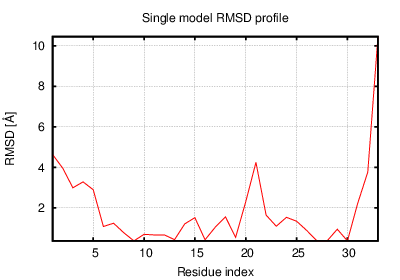
The table contains RMSD and GDT_TS values (calculated on the Cα atoms) between the predicted models and the input structure. Note that GDT_TS metric is intended as a more accurate measurement than the more common RMSD.
Read more about the root-mean-square deviation (RMSD) measure
Read more about the global distance test (GDT, also written as GDT_TS to represent "total score") measure.
| # | 1 | 2 | 3 | 4 | 5 | 6 | 7 | 8 | 9 | 10 | 11 | 12 |
| 1 | 0.00 | 0.86 | 0.83 | 0.76 | 0.80 | 1.11 | 1.18 | 0.97 | 1.14 | 1.25 | 1.00 | 1.52 |
| 2 | 0.86 | 0.00 | 0.85 | 0.95 | 0.95 | 1.13 | 1.02 | 0.88 | 1.04 | 1.07 | 0.94 | 1.26 |
| 3 | 0.83 | 0.85 | 0.00 | 0.93 | 1.01 | 1.31 | 1.21 | 1.23 | 0.99 | 1.18 | 0.81 | 1.41 |
| 4 | 0.76 | 0.95 | 0.93 | 0.00 | 1.01 | 0.92 | 1.15 | 0.87 | 1.22 | 1.05 | 0.98 | 1.64 |
| 5 | 0.80 | 0.95 | 1.01 | 1.01 | 0.00 | 1.39 | 1.17 | 1.14 | 1.31 | 1.17 | 0.91 | 1.54 |
| 6 | 1.11 | 1.13 | 1.31 | 0.92 | 1.39 | 0.00 | 1.39 | 0.87 | 1.44 | 1.39 | 1.40 | 1.82 |
| 7 | 1.18 | 1.02 | 1.21 | 1.15 | 1.17 | 1.39 | 0.00 | 0.98 | 1.17 | 0.59 | 1.10 | 1.31 |
| 8 | 0.97 | 0.88 | 1.23 | 0.87 | 1.14 | 0.87 | 0.98 | 0.00 | 1.29 | 0.97 | 1.15 | 1.54 |
| 9 | 1.14 | 1.04 | 0.99 | 1.22 | 1.31 | 1.44 | 1.17 | 1.29 | 0.00 | 1.20 | 1.18 | 1.04 |
| 10 | 1.25 | 1.07 | 1.18 | 1.05 | 1.17 | 1.39 | 0.59 | 0.97 | 1.20 | 0.00 | 1.01 | 1.37 |
| 11 | 1.00 | 0.94 | 0.81 | 0.98 | 0.91 | 1.40 | 1.10 | 1.15 | 1.18 | 1.01 | 0.00 | 1.51 |
| 12 | 1.52 | 1.26 | 1.41 | 1.64 | 1.54 | 1.82 | 1.31 | 1.54 | 1.04 | 1.37 | 1.51 | 0.00 |
The table contains RMSD values (calculated on the Cα atoms) between the predicted models.
Read more about the root-mean-square deviation (RMSD) measure.
| # | 1 | 2 | 3 | 4 | 5 | 6 | 7 | 8 | 9 | 10 | 11 | 12 |
| 1 | 1.00 | 0.95 | 0.96 | 0.97 | 0.96 | 0.90 | 0.88 | 0.91 | 0.93 | 0.87 | 0.92 | 0.89 |
| 2 | 0.95 | 1.00 | 0.95 | 0.93 | 0.95 | 0.92 | 0.92 | 0.95 | 0.92 | 0.92 | 0.95 | 0.92 |
| 3 | 0.96 | 0.95 | 1.00 | 0.93 | 0.92 | 0.88 | 0.87 | 0.90 | 0.95 | 0.88 | 0.96 | 0.92 |
| 4 | 0.97 | 0.93 | 0.93 | 1.00 | 0.92 | 0.95 | 0.90 | 0.95 | 0.93 | 0.92 | 0.94 | 0.86 |
| 5 | 0.96 | 0.95 | 0.92 | 0.92 | 1.00 | 0.90 | 0.89 | 0.91 | 0.92 | 0.91 | 0.95 | 0.88 |
| 6 | 0.90 | 0.92 | 0.88 | 0.95 | 0.90 | 1.00 | 0.89 | 0.96 | 0.89 | 0.89 | 0.88 | 0.87 |
| 7 | 0.88 | 0.92 | 0.87 | 0.90 | 0.89 | 0.89 | 1.00 | 0.93 | 0.90 | 1.00 | 0.93 | 0.91 |
| 8 | 0.91 | 0.95 | 0.90 | 0.95 | 0.91 | 0.96 | 0.93 | 1.00 | 0.89 | 0.94 | 0.91 | 0.91 |
| 9 | 0.93 | 0.92 | 0.95 | 0.93 | 0.92 | 0.89 | 0.90 | 0.89 | 1.00 | 0.93 | 0.94 | 0.93 |
| 10 | 0.87 | 0.92 | 0.88 | 0.92 | 0.91 | 0.89 | 1.00 | 0.94 | 0.93 | 1.00 | 0.94 | 0.89 |
| 11 | 0.92 | 0.95 | 0.96 | 0.94 | 0.95 | 0.88 | 0.93 | 0.91 | 0.94 | 0.94 | 1.00 | 0.89 |
| 12 | 0.89 | 0.92 | 0.92 | 0.86 | 0.88 | 0.87 | 0.91 | 0.91 | 0.93 | 0.89 | 0.89 | 1.00 |
The table contains GDT_TS values (calculated on the Cα atoms) between the predicted models.
Read more about the global distance test (GDT, also written as GDT_TS to represent "total score") measure.
© Laboratory of Theory of Biopolymers, Faculty of Chemistry, University of Warsaw 2013