Status: Done started: 2018-Jun-20 14:20:34 UTC
| Project Name | |
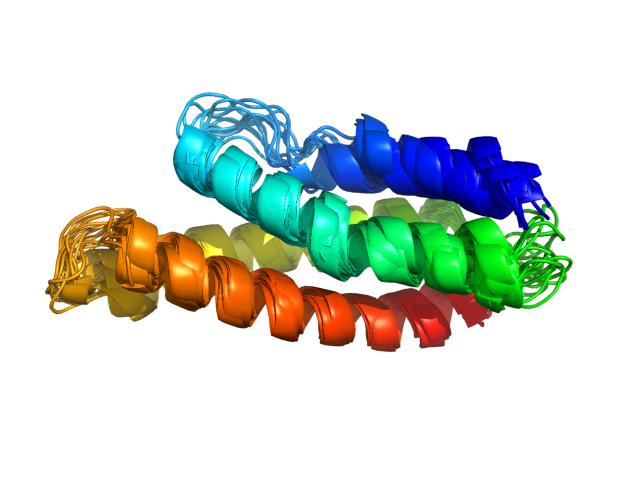
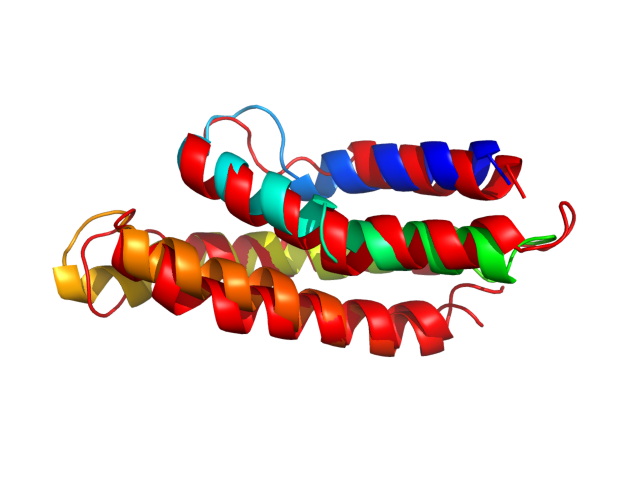
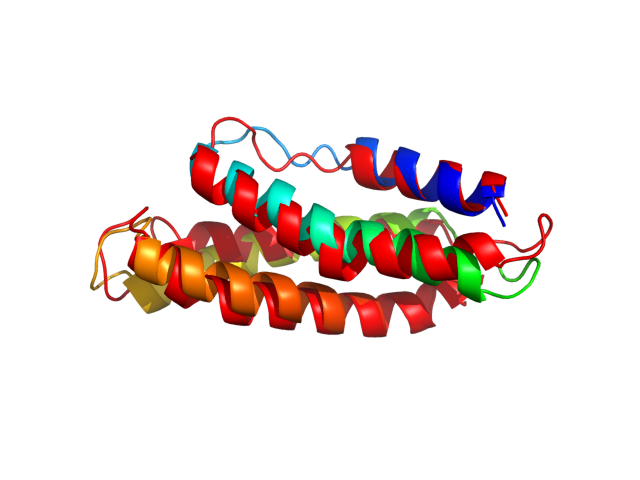
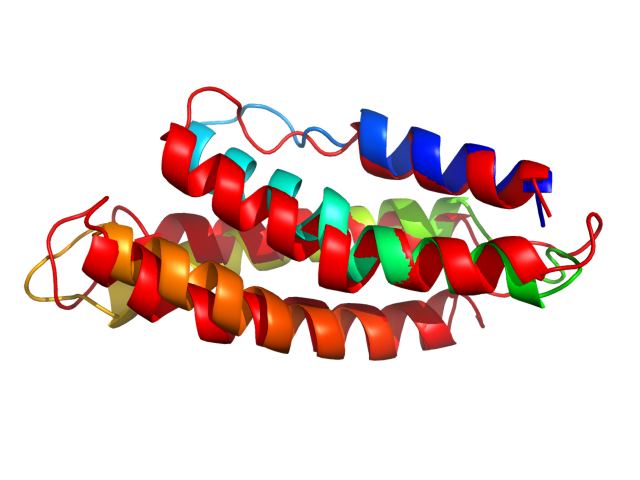
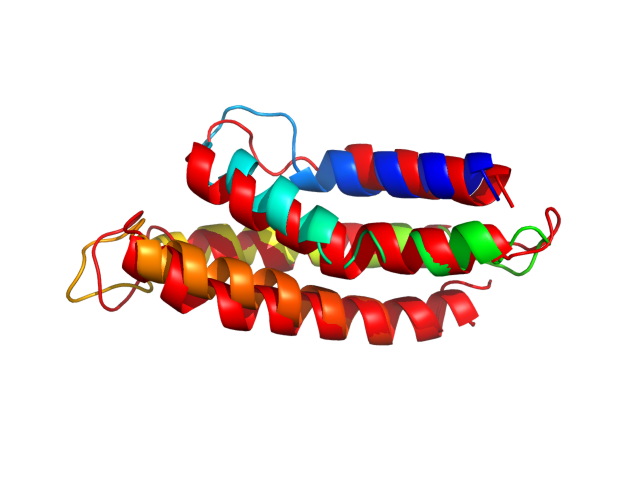
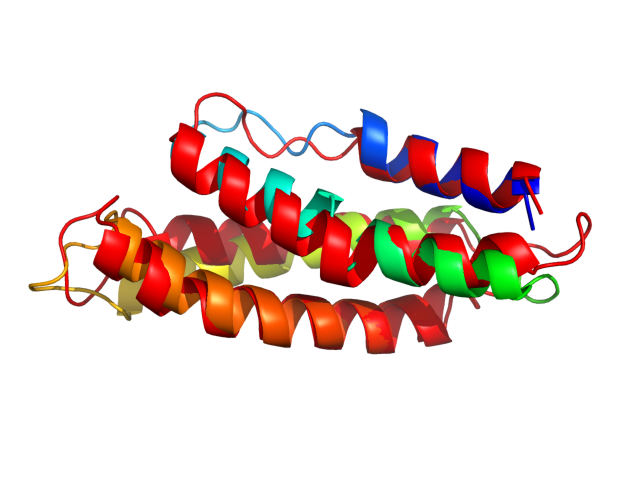
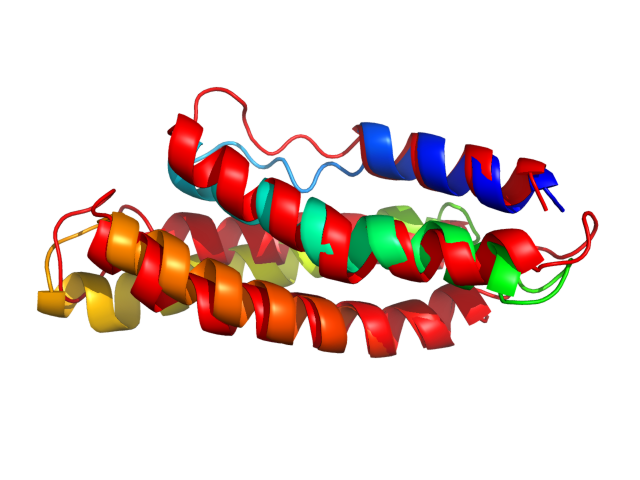
| Sequence | ANNHIRTVLK LFRTIDLDDS KKSFYLTAAK YGIQTQLREP IIRIVGGYLP STKLSEACVK NMISEVYEIE GDFYSKFSYA CEDHAPYSVE CLEDARDDYL TQLVELFKET KKCLRE |
| Secondary structure | CHHHHHHHHH HHHCCCCCCC CCHHHHHHHH HHHHHHCHHH HHHHHHCCCC CCCCCHHHHH HHHHHHHHHH HHHHHHHCCC CCCCCCCCHH HHHHHHHHHH HHHHHHHHHH HHHCCC |
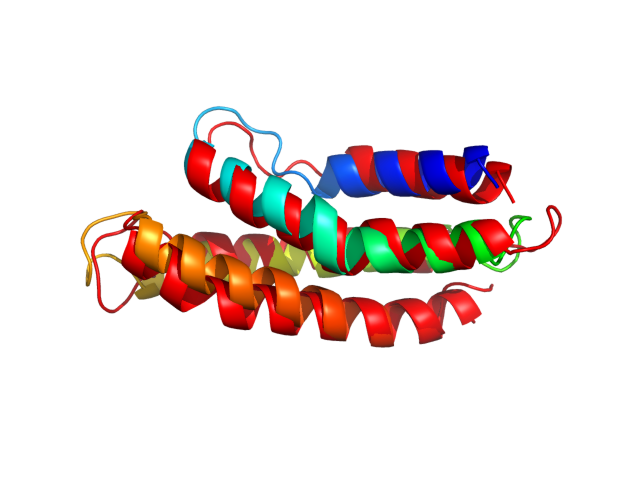
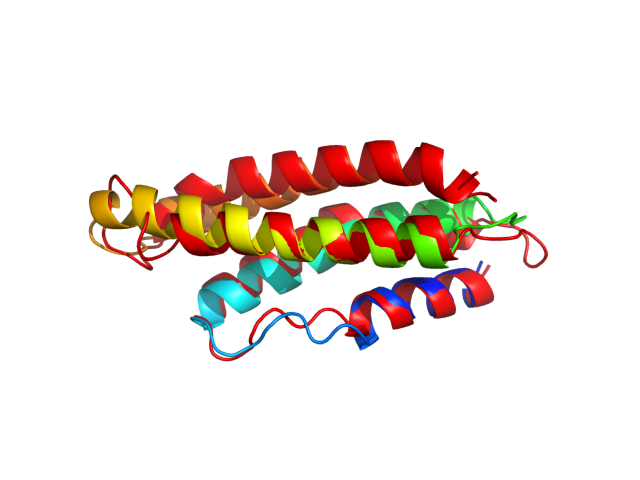
| Movie from predicted structures | To download the movie, right click on the desired file format:  
|
| Estimated finish time | 2018-Jun-20 18:54 UTC |
| Project Name |

| Project Name |
| Cluster # | 1 | 2 | 3 | 4 | 5 | 6 | 7 | 8 | 9 | 10 | 11 | 12 |
| Cluster density | 302.4 | 277.8 | 208.4 | 169.1 | 153.4 | 141.3 | 132.6 | 126.1 | 93.9 | 87.8 | 78.1 | 70.4 |
| Cluster size | 322 | 320 | 223 | 176 | 161 | 152 | 151 | 132 | 102 | 107 | 82 | 72 |
| Average cluster RMSD | 1.1 | 1.2 | 1.1 | 1.0 | 1.0 | 1.1 | 1.1 | 1.0 | 1.1 | 1.2 | 1.1 | 1.0 |
| # | 1 | 2 | 3 | 4 | 5 | 6 | 7 | 8 | 9 | 10 | 11 | 12 |
| RMSD | 2.35 | 2.32 | 2.78 | 2.31 | 2.25 | 2.61 | 2.91 | 2.07 | 2.26 | 2.24 | 2.81 | 3.04 |
| GDT_TS | 0.69 | 0.74 | 0.69 | 0.71 | 0.73 | 0.70 | 0.67 | 0.73 | 0.71 | 0.73 | 0.70 | 0.65 |
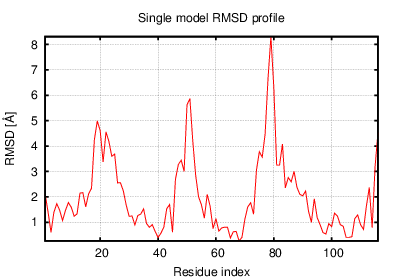
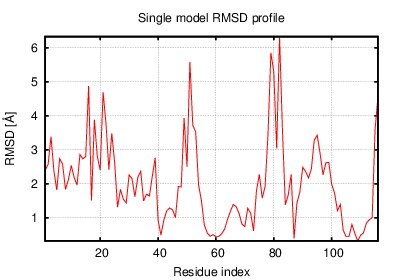
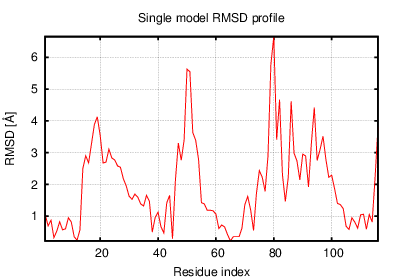
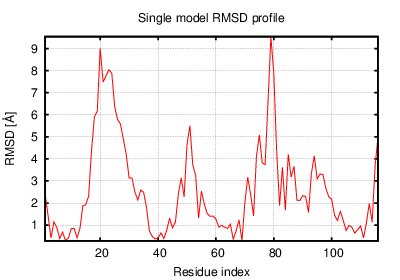
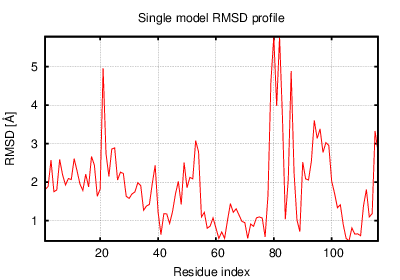
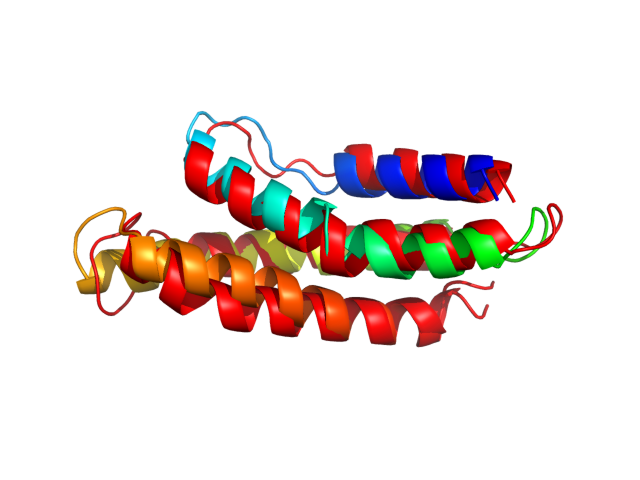
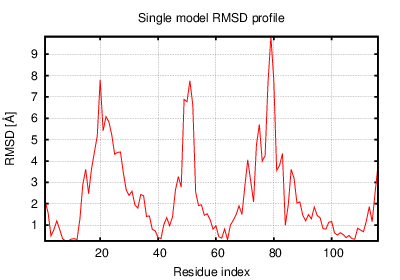
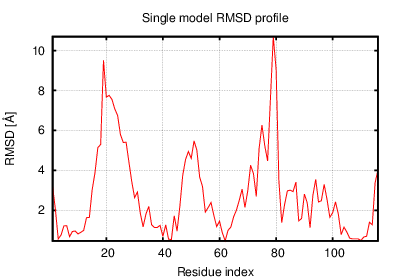
The table contains RMSD and GDT_TS values (calculated on the Cα atoms) between the predicted models and the input structure. Note that GDT_TS metric is intended as a more accurate measurement than the more common RMSD.
Read more about the root-mean-square deviation (RMSD) measure
Read more about the global distance test (GDT, also written as GDT_TS to represent "total score") measure.
| # | 1 | 2 | 3 | 4 | 5 | 6 | 7 | 8 | 9 | 10 | 11 | 12 |
| 1 | 0.00 | 2.28 | 2.46 | 1.17 | 2.10 | 2.28 | 2.38 | 1.35 | 2.20 | 1.35 | 2.55 | 2.64 |
| 2 | 2.28 | 0.00 | 1.66 | 2.28 | 1.69 | 1.45 | 1.66 | 2.23 | 1.67 | 2.22 | 1.54 | 1.86 |
| 3 | 2.46 | 1.66 | 0.00 | 2.48 | 1.56 | 1.39 | 1.27 | 2.39 | 1.77 | 2.43 | 1.38 | 1.37 |
| 4 | 1.17 | 2.28 | 2.48 | 0.00 | 2.06 | 2.30 | 2.36 | 1.20 | 2.15 | 1.48 | 2.54 | 2.63 |
| 5 | 2.10 | 1.69 | 1.56 | 2.06 | 0.00 | 1.40 | 1.80 | 1.81 | 1.39 | 2.11 | 1.86 | 1.88 |
| 6 | 2.28 | 1.45 | 1.39 | 2.30 | 1.40 | 0.00 | 1.55 | 2.19 | 1.64 | 2.35 | 1.53 | 1.56 |
| 7 | 2.38 | 1.66 | 1.27 | 2.36 | 1.80 | 1.55 | 0.00 | 2.48 | 2.03 | 2.34 | 1.47 | 1.64 |
| 8 | 1.35 | 2.23 | 2.39 | 1.20 | 1.81 | 2.19 | 2.48 | 0.00 | 1.88 | 1.59 | 2.57 | 2.61 |
| 9 | 2.20 | 1.67 | 1.77 | 2.15 | 1.39 | 1.64 | 2.03 | 1.88 | 0.00 | 2.06 | 1.81 | 2.13 |
| 10 | 1.35 | 2.22 | 2.43 | 1.48 | 2.11 | 2.35 | 2.34 | 1.59 | 2.06 | 0.00 | 2.49 | 2.71 |
| 11 | 2.55 | 1.54 | 1.38 | 2.54 | 1.86 | 1.53 | 1.47 | 2.57 | 1.81 | 2.49 | 0.00 | 1.69 |
| 12 | 2.64 | 1.86 | 1.37 | 2.63 | 1.88 | 1.56 | 1.64 | 2.61 | 2.13 | 2.71 | 1.69 | 0.00 |
The table contains RMSD values (calculated on the Cα atoms) between the predicted models.
Read more about the root-mean-square deviation (RMSD) measure.
| # | 1 | 2 | 3 | 4 | 5 | 6 | 7 | 8 | 9 | 10 | 11 | 12 |
| 1 | 1.00 | 0.75 | 0.70 | 0.90 | 0.77 | 0.77 | 0.70 | 0.87 | 0.76 | 0.88 | 0.72 | 0.71 |
| 2 | 0.75 | 1.00 | 0.82 | 0.76 | 0.82 | 0.83 | 0.81 | 0.73 | 0.80 | 0.73 | 0.83 | 0.79 |
| 3 | 0.70 | 0.82 | 1.00 | 0.69 | 0.83 | 0.85 | 0.89 | 0.71 | 0.79 | 0.70 | 0.86 | 0.88 |
| 4 | 0.90 | 0.76 | 0.69 | 1.00 | 0.78 | 0.79 | 0.70 | 0.91 | 0.78 | 0.90 | 0.74 | 0.71 |
| 5 | 0.77 | 0.82 | 0.83 | 0.78 | 1.00 | 0.85 | 0.80 | 0.82 | 0.88 | 0.77 | 0.80 | 0.77 |
| 6 | 0.77 | 0.83 | 0.85 | 0.79 | 0.85 | 1.00 | 0.82 | 0.76 | 0.84 | 0.77 | 0.85 | 0.82 |
| 7 | 0.70 | 0.81 | 0.89 | 0.70 | 0.80 | 0.82 | 1.00 | 0.68 | 0.73 | 0.70 | 0.85 | 0.81 |
| 8 | 0.87 | 0.73 | 0.71 | 0.91 | 0.82 | 0.76 | 0.68 | 1.00 | 0.81 | 0.88 | 0.68 | 0.70 |
| 9 | 0.76 | 0.80 | 0.79 | 0.78 | 0.88 | 0.84 | 0.73 | 0.81 | 1.00 | 0.81 | 0.77 | 0.71 |
| 10 | 0.88 | 0.73 | 0.70 | 0.90 | 0.77 | 0.77 | 0.70 | 0.88 | 0.81 | 1.00 | 0.70 | 0.68 |
| 11 | 0.72 | 0.83 | 0.86 | 0.74 | 0.80 | 0.85 | 0.85 | 0.68 | 0.77 | 0.70 | 1.00 | 0.82 |
| 12 | 0.71 | 0.79 | 0.88 | 0.71 | 0.77 | 0.82 | 0.81 | 0.70 | 0.71 | 0.68 | 0.82 | 1.00 |
The table contains GDT_TS values (calculated on the Cα atoms) between the predicted models.
Read more about the global distance test (GDT, also written as GDT_TS to represent "total score") measure.
© Laboratory of Theory of Biopolymers, Faculty of Chemistry, University of Warsaw 2013