Status: Done started: 2018-Jul-31 09:43:30 UTC
| Project Name | |
| Sequence | KTEPSYAKKP RISALHAPQL DQRYKDSFTI GAAVEPYQLQ NEKDVQMLKR HFNSIVAENV MKPINIQPEE GKFNFAEADQ IVRFAKKHHM DIRFHTLVWH SQVPQWFFLD KEGKPMVNET DPAKREQNKQ LLLKRLETHI KTIVERYKDD IKYWDVVNEV VGDDGKLRNS PWYQIAGIDY IKAAFQTART YGGNKIKLYI NDYNTEVEPK RSALYNLVKQ LKEEGVPIDG IGPQSHIQIG WPSEEEIEKT ITMFADLGLD NQITELDVSM YGWPPRAYPS YDAIPEQKFL DQAARYDRLF KLYEKLGDKI SNVTFWGIAD NHTWLDSRAD VYYDADGNVV VDPKAPYTSV EKGKGKDAPF VFDPEYNVKP AYWAIIDHK |
| Secondary structure | CCCCCCCCCC CCCCCCCCCH HHHHCCCCEE EEEECHHHHH CHHHHHHHHH CCCEEEECCC CCHHHHCCCC CCCCCHHHHH HHHHHHHHCC EEEEEEEEEC CCCCCCCCCC CCCCCCCCCC CHHHHHHHHH HHHHHHHHHH HHHHHHHCCC EEEEEEEECC EECCCEECCC HHHHHHCCHH HHHHHHHHHH HHCCCCEEEE EEECCCCHHH HHHHHHHHHH HHHHCCCCCE EEEEEEEECC CCCHHHHHHH HHHHHHHCCE EEEEEEEEEC CCCCCEECCC CCCCCHHHHH HHHHHHHHHH HHHHHCCCCE EEEEEECCCC CCCCHHHHCE EEECCCCCEE CCCCCCCCEE EECCCCCCCC CEECCCEECH HHHHHHHHC |
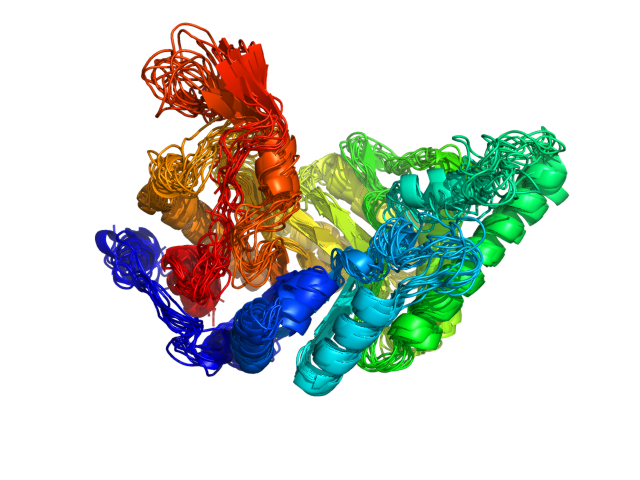
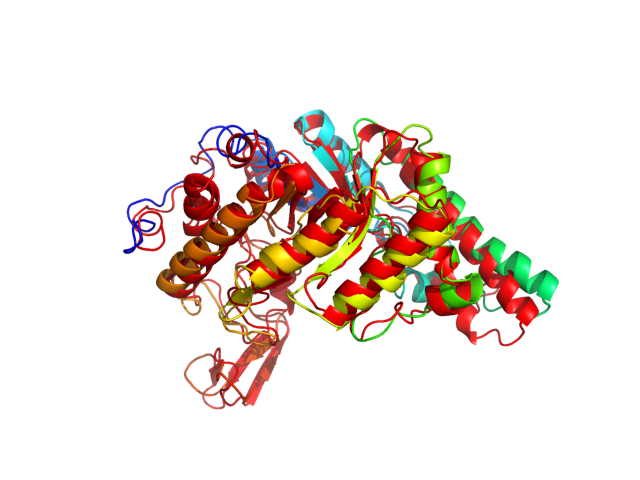
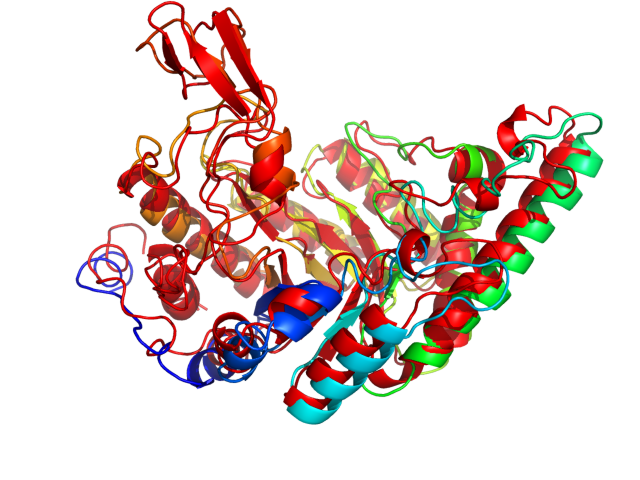
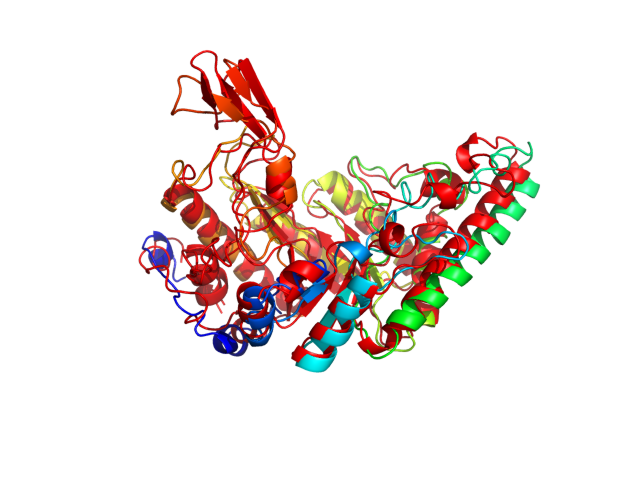
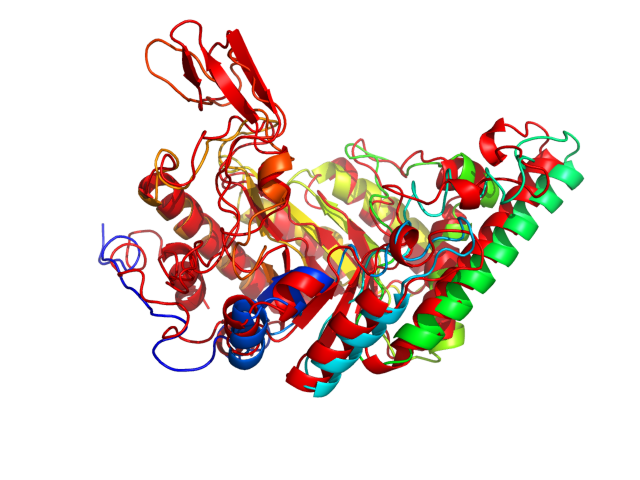
| Movie from predicted structures | To download the movie, right click on the desired file format:  
|
| Estimated finish time | 2018-Jul-31 14:52 UTC |
| Project Name |

| Project Name |
| Cluster # | 1 | 2 | 3 | 4 | 5 | 6 | 7 | 8 | 9 | 10 | 11 | 12 |
| Cluster density | 183.8 | 169.6 | 161.7 | 155.8 | 139.3 | 136.3 | 126.1 | 118.1 | 101.3 | 94.7 | 83.4 | 83.3 |
| Cluster size | 238 | 214 | 201 | 205 | 168 | 167 | 164 | 151 | 124 | 116 | 112 | 140 |
| Average cluster RMSD | 1.3 | 1.3 | 1.2 | 1.3 | 1.2 | 1.2 | 1.3 | 1.3 | 1.2 | 1.2 | 1.3 | 1.7 |
| # | 1 | 2 | 3 | 4 | 5 | 6 | 7 | 8 | 9 | 10 | 11 | 12 |
| RMSD | 2.66 | 2.98 | 2.69 | 2.71 | 2.58 | 2.86 | 2.84 | 2.75 | 2.69 | 2.74 | 3.05 | 2.52 |
| GDT_TS | 0.67 | 0.64 | 0.65 | 0.64 | 0.66 | 0.66 | 0.65 | 0.66 | 0.66 | 0.65 | 0.66 | 0.67 |
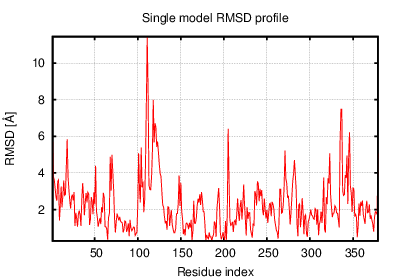
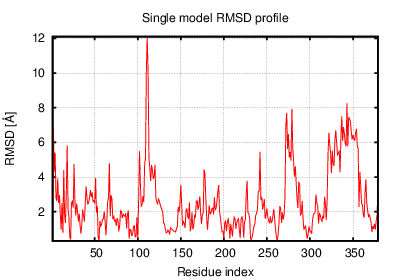
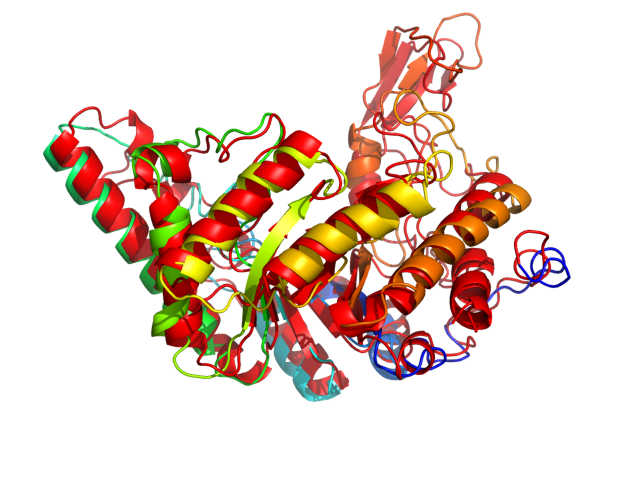
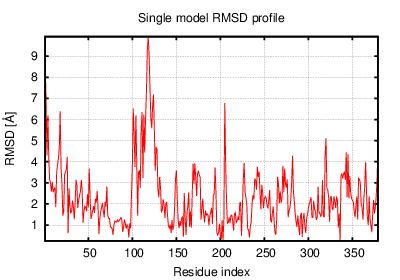
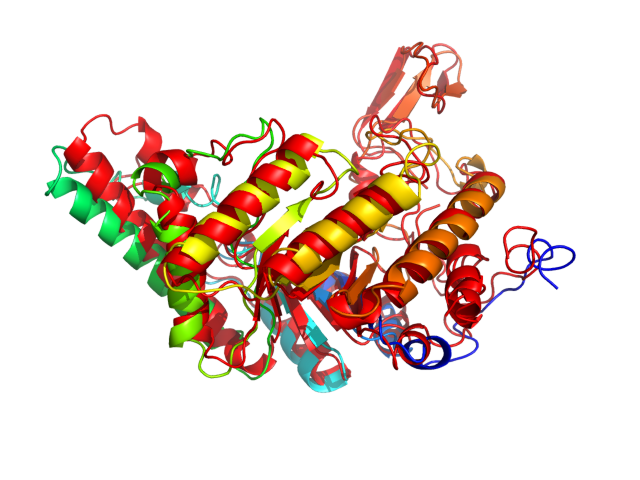
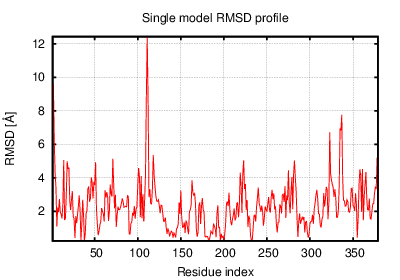
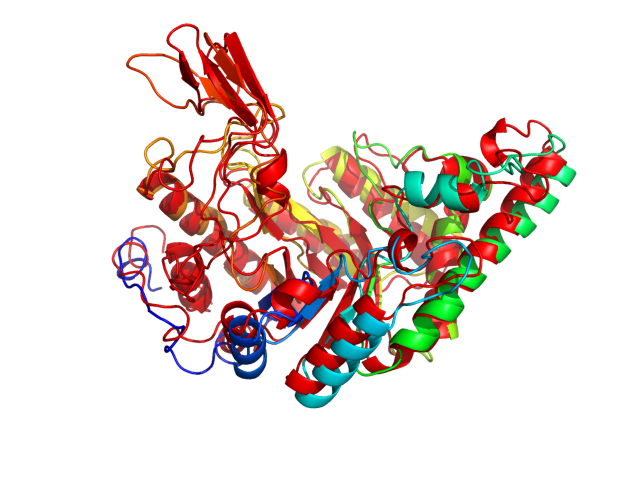
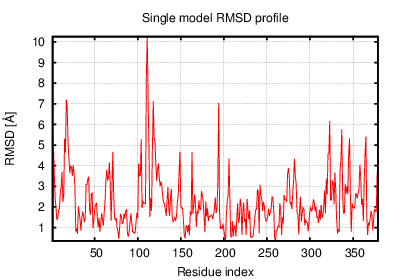
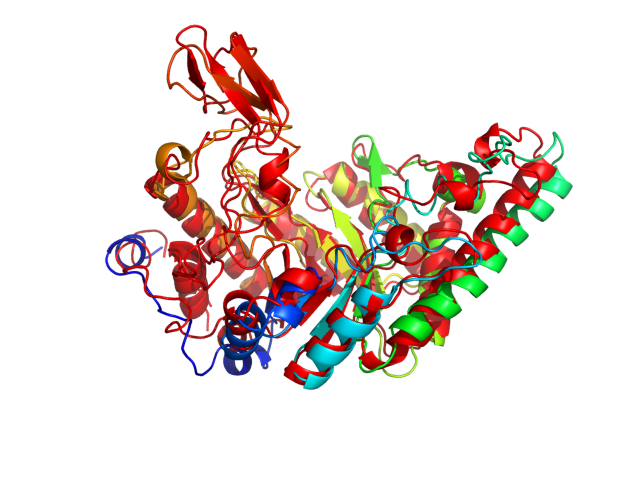
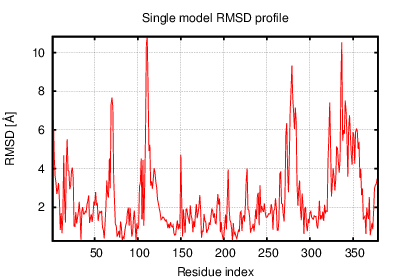
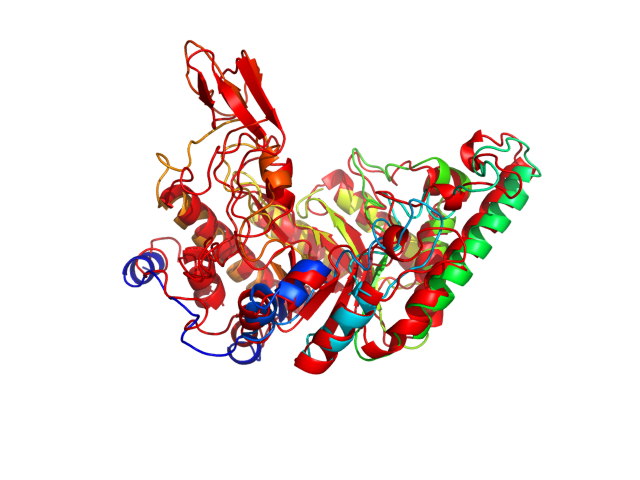
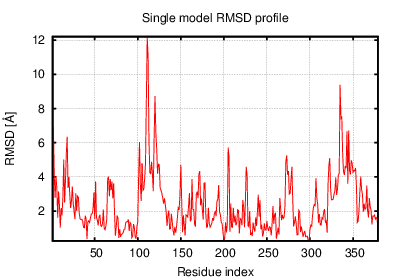
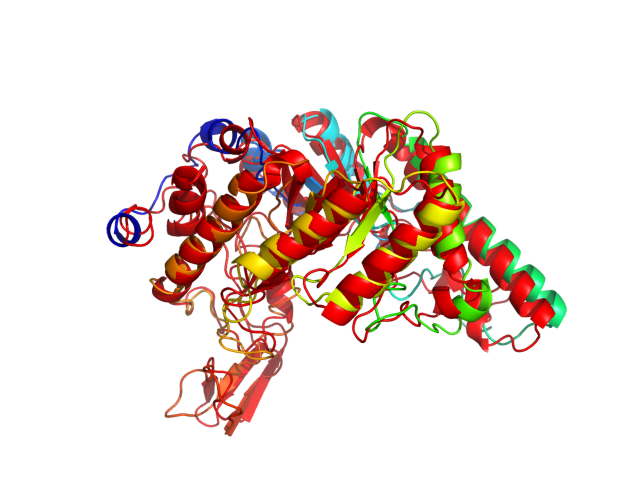
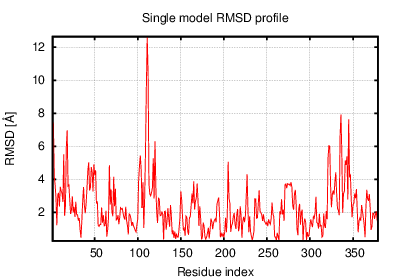
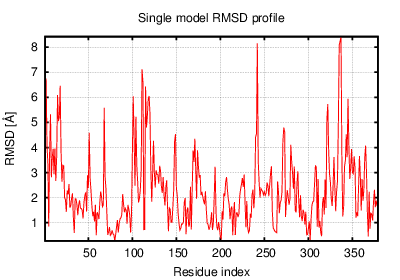
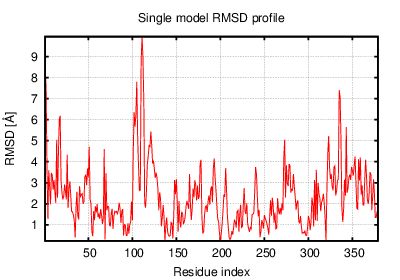
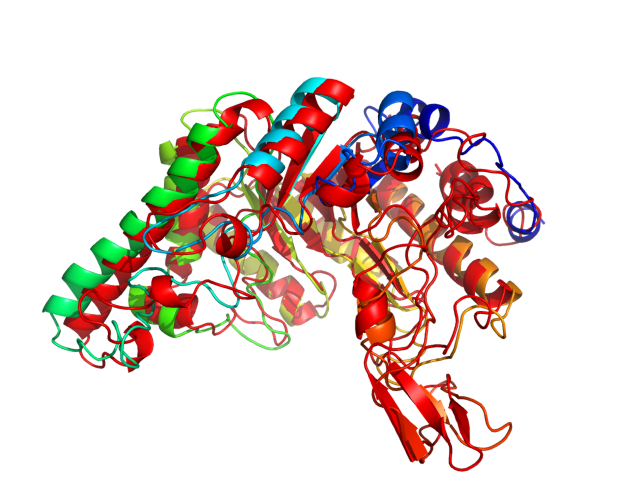
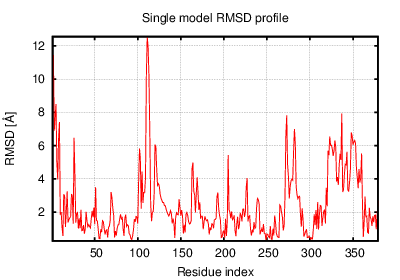
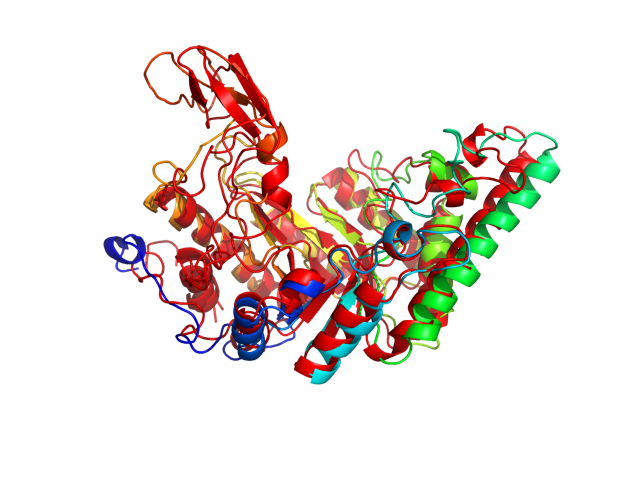
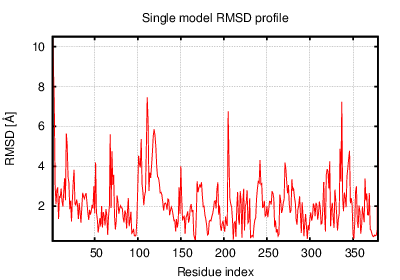
The table contains RMSD and GDT_TS values (calculated on the Cα atoms) between the predicted models and the input structure. Note that GDT_TS metric is intended as a more accurate measurement than the more common RMSD.
Read more about the root-mean-square deviation (RMSD) measure
Read more about the global distance test (GDT, also written as GDT_TS to represent "total score") measure.
| # | 1 | 2 | 3 | 4 | 5 | 6 | 7 | 8 | 9 | 10 | 11 | 12 |
| 1 | 0.00 | 2.66 | 1.97 | 2.23 | 2.29 | 2.41 | 2.43 | 2.17 | 2.45 | 2.39 | 2.84 | 1.67 |
| 2 | 2.66 | 0.00 | 2.85 | 2.95 | 3.06 | 2.05 | 2.14 | 2.18 | 3.02 | 2.42 | 2.68 | 2.68 |
| 3 | 1.97 | 2.85 | 0.00 | 2.30 | 2.45 | 2.71 | 2.75 | 2.60 | 2.39 | 2.70 | 3.14 | 1.94 |
| 4 | 2.23 | 2.95 | 2.30 | 0.00 | 2.14 | 2.61 | 2.76 | 2.33 | 2.47 | 2.64 | 2.94 | 2.29 |
| 5 | 2.29 | 3.06 | 2.45 | 2.14 | 0.00 | 2.91 | 2.78 | 2.48 | 2.21 | 2.58 | 2.89 | 2.32 |
| 6 | 2.41 | 2.05 | 2.71 | 2.61 | 2.91 | 0.00 | 2.44 | 2.23 | 3.02 | 2.47 | 2.92 | 2.54 |
| 7 | 2.43 | 2.14 | 2.75 | 2.76 | 2.78 | 2.44 | 0.00 | 2.29 | 2.77 | 1.88 | 2.41 | 2.44 |
| 8 | 2.17 | 2.18 | 2.60 | 2.33 | 2.48 | 2.23 | 2.29 | 0.00 | 2.62 | 2.44 | 2.90 | 2.39 |
| 9 | 2.45 | 3.02 | 2.39 | 2.47 | 2.21 | 3.02 | 2.77 | 2.62 | 0.00 | 2.61 | 3.02 | 2.36 |
| 10 | 2.39 | 2.42 | 2.70 | 2.64 | 2.58 | 2.47 | 1.88 | 2.44 | 2.61 | 0.00 | 2.24 | 2.40 |
| 11 | 2.84 | 2.68 | 3.14 | 2.94 | 2.89 | 2.92 | 2.41 | 2.90 | 3.02 | 2.24 | 0.00 | 2.87 |
| 12 | 1.67 | 2.68 | 1.94 | 2.29 | 2.32 | 2.54 | 2.44 | 2.39 | 2.36 | 2.40 | 2.87 | 0.00 |
The table contains RMSD values (calculated on the Cα atoms) between the predicted models.
Read more about the root-mean-square deviation (RMSD) measure.
| # | 1 | 2 | 3 | 4 | 5 | 6 | 7 | 8 | 9 | 10 | 11 | 12 |
| 1 | 1.00 | 0.68 | 0.78 | 0.71 | 0.71 | 0.70 | 0.70 | 0.74 | 0.71 | 0.69 | 0.66 | 0.82 |
| 2 | 0.68 | 1.00 | 0.66 | 0.63 | 0.64 | 0.75 | 0.73 | 0.73 | 0.65 | 0.72 | 0.71 | 0.68 |
| 3 | 0.78 | 0.66 | 1.00 | 0.69 | 0.71 | 0.67 | 0.67 | 0.69 | 0.72 | 0.65 | 0.63 | 0.79 |
| 4 | 0.71 | 0.63 | 0.69 | 1.00 | 0.73 | 0.66 | 0.62 | 0.70 | 0.69 | 0.65 | 0.62 | 0.71 |
| 5 | 0.71 | 0.64 | 0.71 | 0.73 | 1.00 | 0.64 | 0.64 | 0.68 | 0.72 | 0.66 | 0.62 | 0.72 |
| 6 | 0.70 | 0.75 | 0.67 | 0.66 | 0.64 | 1.00 | 0.73 | 0.72 | 0.66 | 0.70 | 0.67 | 0.69 |
| 7 | 0.70 | 0.73 | 0.67 | 0.62 | 0.64 | 0.73 | 1.00 | 0.70 | 0.67 | 0.78 | 0.72 | 0.69 |
| 8 | 0.74 | 0.73 | 0.69 | 0.70 | 0.68 | 0.72 | 0.70 | 1.00 | 0.68 | 0.69 | 0.67 | 0.72 |
| 9 | 0.71 | 0.65 | 0.72 | 0.69 | 0.72 | 0.66 | 0.67 | 0.68 | 1.00 | 0.68 | 0.64 | 0.72 |
| 10 | 0.69 | 0.72 | 0.65 | 0.65 | 0.66 | 0.70 | 0.78 | 0.69 | 0.68 | 1.00 | 0.73 | 0.70 |
| 11 | 0.66 | 0.71 | 0.63 | 0.62 | 0.62 | 0.67 | 0.72 | 0.67 | 0.64 | 0.73 | 1.00 | 0.66 |
| 12 | 0.82 | 0.68 | 0.79 | 0.71 | 0.72 | 0.69 | 0.69 | 0.72 | 0.72 | 0.70 | 0.66 | 1.00 |
The table contains GDT_TS values (calculated on the Cα atoms) between the predicted models.
Read more about the global distance test (GDT, also written as GDT_TS to represent "total score") measure.
© Laboratory of Theory of Biopolymers, Faculty of Chemistry, University of Warsaw 2013