Status: Done started: 2018-Nov-06 19:52:49 UTC
| Project Name | |
| Sequence | TADNKFNKEQ QNAFYEILHL PNLNEEQRNG FIQSLKTTLE RIEKNFVITD PRLPDNPIIF ASDSFLQLTE YSREEILGRN CRFLQGPETD RATVRKIRDA IDNQTEVTVQ LINYTKSGKK FWNLFHLQPM RDQKGDVQYF IGVQLDGTEH VRDAAEREGV MLIKKTAENI DEAASANLLA EAKKLNDAQA PKA |
| Secondary structure | CCCCCCCCCH HHHHHHHCCC CCCCHHHHHH HHHCCCCCCC CCCCCEEEEC CCCCCCCEEE ECHHHHHHHC CCHHHHCCCC CCCCCCCCCC HHHHHHHHHH HHCCCCEEEE EEEECCCCCE EEEEEEEEEE ECCCCCEEEE EEEEEEECCC CCHHHHHHHH HHHHHHHHHH HHHCHHHHHH HHHHHHHHHC CCC |
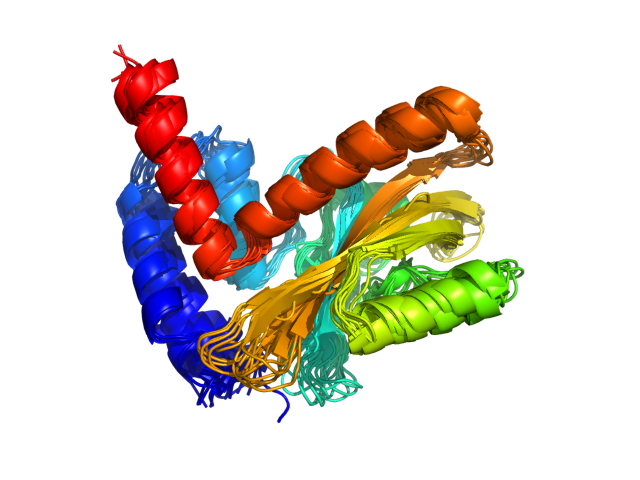
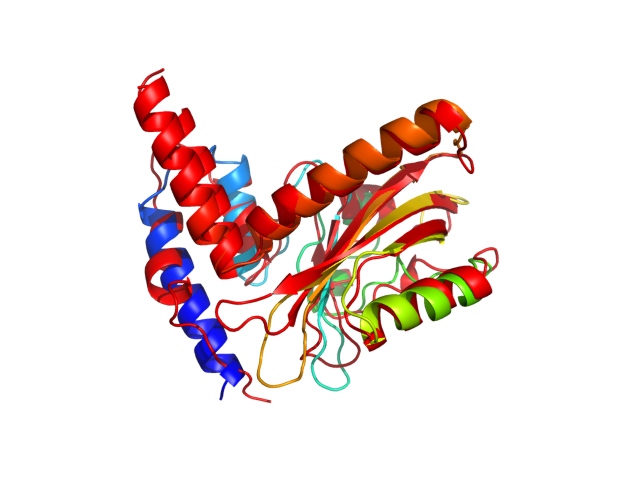
| Movie from predicted structures | To download the movie, right click on the desired file format:  
|
| Estimated finish time | 2018-Nov-06 23:37 UTC |
| Project Name |


| Project Name |
| Cluster # | 1 | 2 | 3 | 4 | 5 | 6 | 7 | 8 | 9 | 10 | 11 | 12 |
| Cluster density | 152.7 | 132.4 | 123.1 | 117.6 | 116.2 | 115.3 | 113.9 | 112.4 | 108.7 | 108.2 | 105.1 | 98.7 |
| Cluster size | 243 | 178 | 155 | 174 | 150 | 160 | 161 | 167 | 163 | 145 | 161 | 143 |
| Average cluster RMSD | 1.6 | 1.3 | 1.3 | 1.5 | 1.3 | 1.4 | 1.4 | 1.5 | 1.5 | 1.3 | 1.5 | 1.4 |
| # | 1 | 2 | 3 | 4 | 5 | 6 | 7 | 8 | 9 | 10 | 11 | 12 |
| RMSD | 2.94 | 2.87 | 3.09 | 2.72 | 3.17 | 2.94 | 2.99 | 2.96 | 2.96 | 2.98 | 2.71 | 2.83 |
| GDT_TS | 0.66 | 0.67 | 0.64 | 0.66 | 0.64 | 0.66 | 0.66 | 0.65 | 0.66 | 0.67 | 0.67 | 0.67 |
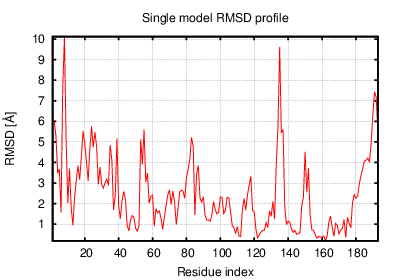
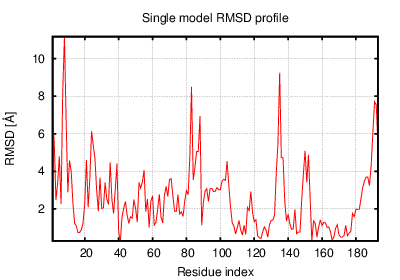
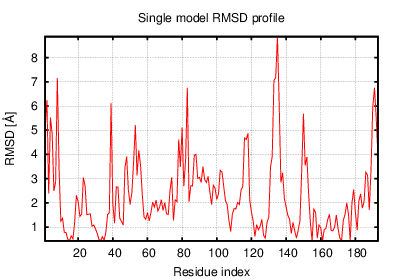
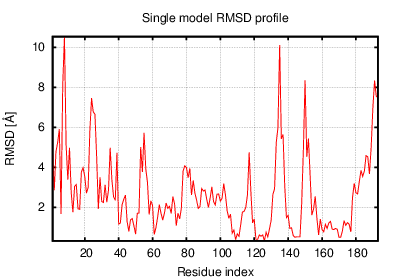
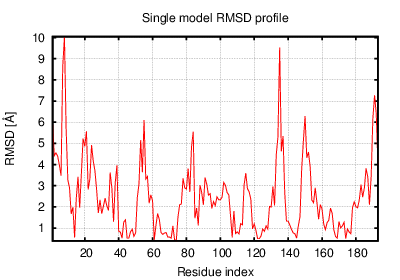
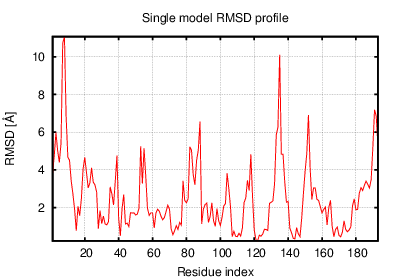
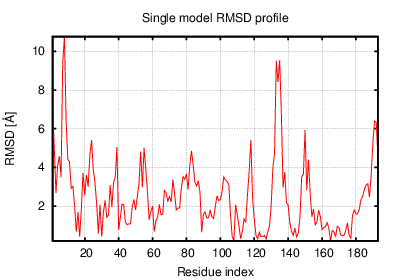
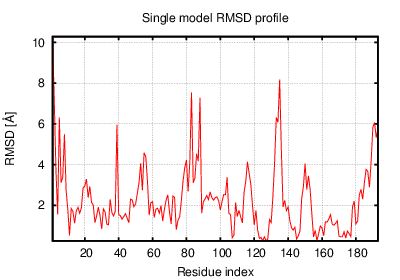
The table contains RMSD and GDT_TS values (calculated on the Cα atoms) between the predicted models and the input structure. Note that GDT_TS metric is intended as a more accurate measurement than the more common RMSD.
Read more about the root-mean-square deviation (RMSD) measure
Read more about the global distance test (GDT, also written as GDT_TS to represent "total score") measure.
| # | 1 | 2 | 3 | 4 | 5 | 6 | 7 | 8 | 9 | 10 | 11 | 12 |
| 1 | 0.00 | 2.12 | 2.05 | 2.14 | 2.38 | 2.25 | 2.15 | 1.63 | 1.46 | 2.37 | 2.07 | 1.96 |
| 2 | 2.12 | 0.00 | 2.00 | 2.42 | 1.82 | 1.67 | 1.83 | 2.15 | 2.06 | 1.90 | 2.57 | 2.43 |
| 3 | 2.05 | 2.00 | 0.00 | 2.54 | 2.28 | 2.05 | 1.86 | 1.97 | 1.84 | 2.08 | 2.45 | 2.46 |
| 4 | 2.14 | 2.42 | 2.54 | 0.00 | 2.82 | 2.48 | 2.21 | 2.22 | 2.11 | 2.30 | 1.86 | 2.21 |
| 5 | 2.38 | 1.82 | 2.28 | 2.82 | 0.00 | 1.91 | 2.30 | 2.39 | 2.30 | 2.21 | 2.94 | 2.61 |
| 6 | 2.25 | 1.67 | 2.05 | 2.48 | 1.91 | 0.00 | 1.85 | 2.11 | 2.18 | 1.92 | 2.52 | 2.26 |
| 7 | 2.15 | 1.83 | 1.86 | 2.21 | 2.30 | 1.85 | 0.00 | 1.89 | 2.03 | 1.42 | 2.28 | 2.50 |
| 8 | 1.63 | 2.15 | 1.97 | 2.22 | 2.39 | 2.11 | 1.89 | 0.00 | 1.62 | 1.92 | 2.14 | 2.17 |
| 9 | 1.46 | 2.06 | 1.84 | 2.11 | 2.30 | 2.18 | 2.03 | 1.62 | 0.00 | 2.11 | 2.02 | 2.05 |
| 10 | 2.37 | 1.90 | 2.08 | 2.30 | 2.21 | 1.92 | 1.42 | 1.92 | 2.11 | 0.00 | 2.47 | 2.66 |
| 11 | 2.07 | 2.57 | 2.45 | 1.86 | 2.94 | 2.52 | 2.28 | 2.14 | 2.02 | 2.47 | 0.00 | 2.04 |
| 12 | 1.96 | 2.43 | 2.46 | 2.21 | 2.61 | 2.26 | 2.50 | 2.17 | 2.05 | 2.66 | 2.04 | 0.00 |
The table contains RMSD values (calculated on the Cα atoms) between the predicted models.
Read more about the root-mean-square deviation (RMSD) measure.
| # | 1 | 2 | 3 | 4 | 5 | 6 | 7 | 8 | 9 | 10 | 11 | 12 |
| 1 | 1.00 | 0.75 | 0.80 | 0.79 | 0.75 | 0.75 | 0.78 | 0.82 | 0.86 | 0.77 | 0.78 | 0.79 |
| 2 | 0.75 | 1.00 | 0.78 | 0.72 | 0.81 | 0.79 | 0.80 | 0.75 | 0.77 | 0.77 | 0.72 | 0.71 |
| 3 | 0.80 | 0.78 | 1.00 | 0.71 | 0.76 | 0.75 | 0.77 | 0.81 | 0.79 | 0.78 | 0.76 | 0.72 |
| 4 | 0.79 | 0.72 | 0.71 | 1.00 | 0.71 | 0.72 | 0.77 | 0.76 | 0.79 | 0.76 | 0.84 | 0.80 |
| 5 | 0.75 | 0.81 | 0.76 | 0.71 | 1.00 | 0.78 | 0.77 | 0.73 | 0.74 | 0.77 | 0.69 | 0.73 |
| 6 | 0.75 | 0.79 | 0.75 | 0.72 | 0.78 | 1.00 | 0.81 | 0.76 | 0.73 | 0.77 | 0.74 | 0.74 |
| 7 | 0.78 | 0.80 | 0.77 | 0.77 | 0.77 | 0.81 | 1.00 | 0.79 | 0.77 | 0.86 | 0.77 | 0.73 |
| 8 | 0.82 | 0.75 | 0.81 | 0.76 | 0.73 | 0.76 | 0.79 | 1.00 | 0.82 | 0.81 | 0.78 | 0.77 |
| 9 | 0.86 | 0.77 | 0.79 | 0.79 | 0.74 | 0.73 | 0.77 | 0.82 | 1.00 | 0.79 | 0.81 | 0.77 |
| 10 | 0.77 | 0.77 | 0.78 | 0.76 | 0.77 | 0.77 | 0.86 | 0.81 | 0.79 | 1.00 | 0.75 | 0.73 |
| 11 | 0.78 | 0.72 | 0.76 | 0.84 | 0.69 | 0.74 | 0.77 | 0.78 | 0.81 | 0.75 | 1.00 | 0.79 |
| 12 | 0.79 | 0.71 | 0.72 | 0.80 | 0.73 | 0.74 | 0.73 | 0.77 | 0.77 | 0.73 | 0.79 | 1.00 |
The table contains GDT_TS values (calculated on the Cα atoms) between the predicted models.
Read more about the global distance test (GDT, also written as GDT_TS to represent "total score") measure.
© Laboratory of Theory of Biopolymers, Faculty of Chemistry, University of Warsaw 2013