Status: Done started: 2018-Jun-09 14:33:42 UTC
| Project Name | |
| Sequence | HFPRACVSSK NLMEKECCPP WSGDRSPCGQ LSGRGSCQNI LLSNAPLGPQ FPFTGVDDRE SWPSVFYNRT CQCSGNFMVF NCGNCKFGFW GPNCTE |
| Secondary structure | CCCCCCCCHH HHHHHCCCCC CCCCCCCCCH HHHCCCCCCH HHHCCCCCCC CCCCCCEEEC CCCCCEEEEE CCCCCEECCC CCCCCCCCCC CCCCCC |
| Movie from predicted structures | To download the movie, right click on the desired file format:  
|
| Estimated finish time | 2018-Jun-09 19:05 UTC |
| Project Name |


| Project Name |
| Cluster # | 1 | 2 | 3 | 4 | 5 | 6 | 7 | 8 | 9 | 10 | 11 | 12 |
| Cluster density | 188.4 | 161.3 | 109.4 | 81.4 | 79.0 | 77.5 | 67.8 | 64.7 | 63.5 | 42.9 | 36.2 | 28.6 |
| Cluster size | 411 | 339 | 220 | 175 | 149 | 131 | 137 | 125 | 107 | 97 | 59 | 50 |
| Average cluster RMSD | 2.2 | 2.1 | 2.0 | 2.2 | 1.9 | 1.7 | 2.0 | 1.9 | 1.7 | 2.3 | 1.6 | 1.7 |
| # | 1 | 2 | 3 | 4 | 5 | 6 | 7 | 8 | 9 | 10 | 11 | 12 |
| RMSD | 5.74 | 5.07 | 5.86 | 5.44 | 5.47 | 5.41 | 4.91 | 5.38 | 5.25 | 5.76 | 5.34 | 5.28 |
| GDT_TS | 0.48 | 0.49 | 0.45 | 0.47 | 0.47 | 0.47 | 0.52 | 0.49 | 0.47 | 0.47 | 0.46 | 0.48 |
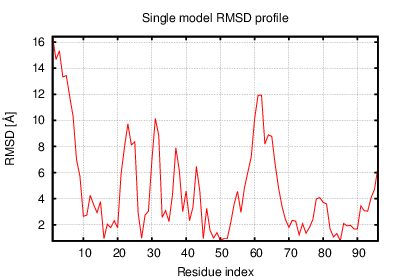
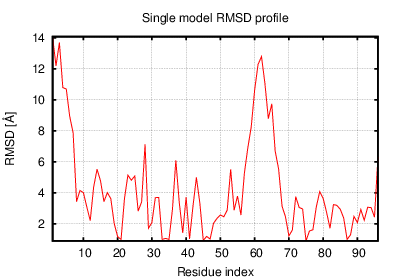
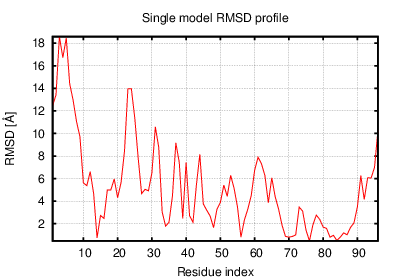
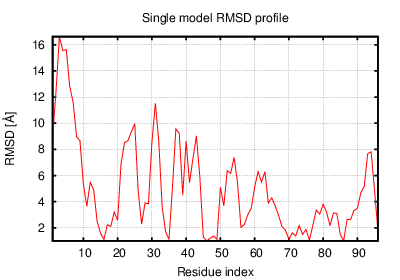
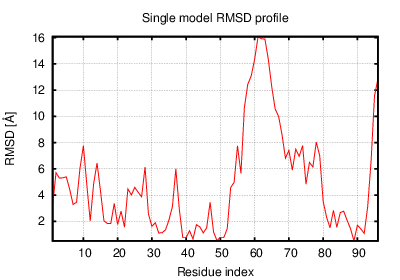
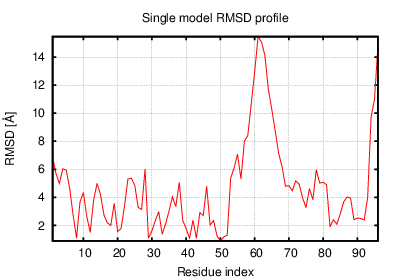
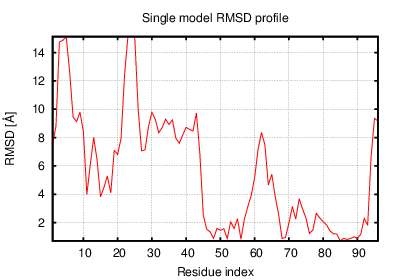
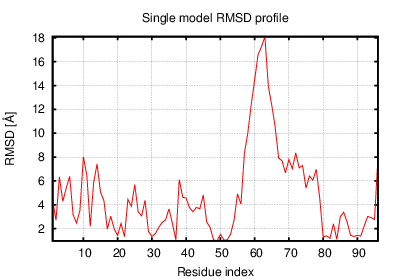
The table contains RMSD and GDT_TS values (calculated on the Cα atoms) between the predicted models and the input structure. Note that GDT_TS metric is intended as a more accurate measurement than the more common RMSD.
Read more about the root-mean-square deviation (RMSD) measure
Read more about the global distance test (GDT, also written as GDT_TS to represent "total score") measure.
| # | 1 | 2 | 3 | 4 | 5 | 6 | 7 | 8 | 9 | 10 | 11 | 12 |
| 1 | 0.00 | 3.02 | 2.75 | 2.45 | 3.82 | 2.93 | 3.27 | 5.16 | 3.92 | 4.46 | 6.04 | 5.37 |
| 2 | 3.02 | 0.00 | 3.73 | 3.45 | 3.22 | 3.15 | 3.64 | 3.94 | 3.18 | 3.57 | 4.43 | 3.90 |
| 3 | 2.75 | 3.73 | 0.00 | 2.89 | 4.24 | 3.54 | 3.29 | 5.17 | 4.28 | 4.72 | 6.19 | 5.65 |
| 4 | 2.45 | 3.45 | 2.89 | 0.00 | 3.97 | 3.32 | 3.10 | 5.00 | 4.25 | 4.74 | 5.71 | 5.21 |
| 5 | 3.82 | 3.22 | 4.24 | 3.97 | 0.00 | 3.91 | 4.04 | 3.60 | 2.81 | 3.41 | 4.09 | 3.79 |
| 6 | 2.93 | 3.15 | 3.54 | 3.32 | 3.91 | 0.00 | 3.57 | 4.97 | 4.08 | 4.32 | 5.78 | 5.17 |
| 7 | 3.27 | 3.64 | 3.29 | 3.10 | 4.04 | 3.57 | 0.00 | 4.98 | 4.30 | 4.88 | 5.62 | 5.00 |
| 8 | 5.16 | 3.94 | 5.17 | 5.00 | 3.60 | 4.97 | 4.98 | 0.00 | 2.82 | 4.22 | 3.23 | 3.67 |
| 9 | 3.92 | 3.18 | 4.28 | 4.25 | 2.81 | 4.08 | 4.30 | 2.82 | 0.00 | 3.64 | 3.73 | 3.57 |
| 10 | 4.46 | 3.57 | 4.72 | 4.74 | 3.41 | 4.32 | 4.88 | 4.22 | 3.64 | 0.00 | 4.74 | 4.83 |
| 11 | 6.04 | 4.43 | 6.19 | 5.71 | 4.09 | 5.78 | 5.62 | 3.23 | 3.73 | 4.74 | 0.00 | 2.46 |
| 12 | 5.37 | 3.90 | 5.65 | 5.21 | 3.79 | 5.17 | 5.00 | 3.67 | 3.57 | 4.83 | 2.46 | 0.00 |
The table contains RMSD values (calculated on the Cα atoms) between the predicted models.
Read more about the root-mean-square deviation (RMSD) measure.
| # | 1 | 2 | 3 | 4 | 5 | 6 | 7 | 8 | 9 | 10 | 11 | 12 |
| 1 | 1.00 | 0.65 | 0.66 | 0.69 | 0.61 | 0.63 | 0.61 | 0.47 | 0.57 | 0.55 | 0.46 | 0.48 |
| 2 | 0.65 | 1.00 | 0.55 | 0.58 | 0.64 | 0.62 | 0.55 | 0.53 | 0.64 | 0.62 | 0.55 | 0.59 |
| 3 | 0.66 | 0.55 | 1.00 | 0.65 | 0.54 | 0.56 | 0.65 | 0.46 | 0.52 | 0.51 | 0.41 | 0.45 |
| 4 | 0.69 | 0.58 | 0.65 | 1.00 | 0.58 | 0.60 | 0.65 | 0.47 | 0.55 | 0.53 | 0.47 | 0.47 |
| 5 | 0.61 | 0.64 | 0.54 | 0.58 | 1.00 | 0.56 | 0.57 | 0.56 | 0.65 | 0.66 | 0.52 | 0.58 |
| 6 | 0.63 | 0.62 | 0.56 | 0.60 | 0.56 | 1.00 | 0.62 | 0.47 | 0.56 | 0.59 | 0.46 | 0.50 |
| 7 | 0.61 | 0.55 | 0.65 | 0.65 | 0.57 | 0.62 | 1.00 | 0.46 | 0.54 | 0.54 | 0.46 | 0.49 |
| 8 | 0.47 | 0.53 | 0.46 | 0.47 | 0.56 | 0.47 | 0.46 | 1.00 | 0.61 | 0.51 | 0.61 | 0.58 |
| 9 | 0.57 | 0.64 | 0.52 | 0.55 | 0.65 | 0.56 | 0.54 | 0.61 | 1.00 | 0.61 | 0.56 | 0.57 |
| 10 | 0.55 | 0.62 | 0.51 | 0.53 | 0.66 | 0.59 | 0.54 | 0.51 | 0.61 | 1.00 | 0.49 | 0.48 |
| 11 | 0.46 | 0.55 | 0.41 | 0.47 | 0.52 | 0.46 | 0.46 | 0.61 | 0.56 | 0.49 | 1.00 | 0.77 |
| 12 | 0.48 | 0.59 | 0.45 | 0.47 | 0.58 | 0.50 | 0.49 | 0.58 | 0.57 | 0.48 | 0.77 | 1.00 |
The table contains GDT_TS values (calculated on the Cα atoms) between the predicted models.
Read more about the global distance test (GDT, also written as GDT_TS to represent "total score") measure.
© Laboratory of Theory of Biopolymers, Faculty of Chemistry, University of Warsaw 2013