Status: Done started: 2018-Oct-13 17:01:06 UTC
| Project Name | |
| Sequence | GSHMASMTGG QQMGRGSMGN LMISFLKKDT QSITLEELAK IIKKCKHVVA LTGSGTSAES NIPSFRGSSN SIWSKYDPRI YGTIWGFWKY PEKIWEVIRD ISSDYEIEIN NGHVALSTLE SLGYLKSVVT QNVDGLHEAS GNTKVISLHG NVFEAVCCTC NKIVKLNKIM LQKTSHFMHQ LPPECPCGGI FKPNIILFGE VVSSDLLKEA EEEIAKCDLL LVIGTSSTVS TATNLCHFAC KKKKKIVEIN ISKTYITNKM SDYHVCAKFS ELTKVANILK GSSEKNKKIM |
| Secondary structure | CCCCCCCCCC CCCCCCCCCC CCCCCCCCCC EEECHHHHHH HHHHCCCEEE EECCHHHHCC CCCCCCCCCC CCCCCCCHHH HHCHHHHHHC HHHHHHHHHH HHHHCCCCCC HHHHHHHHHH HHCCEEEEEE CCCCCHHHHC CCCCEEECCE EEEEEEECCC CCEEECCHHH HCCCCHHHHC CCCCCCCCCC EEEEECCCCC CCCHHHHHHH HHHHHHCCEE EEECCCCCCH HHHHHHHHHH HCCCEEEEEE CCCCCCCCCC CCEEEECCCC CCHHHHHHHH HHHCCCCCCC |
| Movie from predicted structures | To download the movie, right click on the desired file format:  
|
| Estimated finish time | 2018-Oct-13 21:58 UTC |
| Project Name |
| Project Name |
| Cluster # | 1 | 2 | 3 | 4 | 5 | 6 | 7 | 8 | 9 | 10 | 11 | 12 |
| Cluster density | 226.7 | 169.8 | 110.7 | 106.6 | 81.4 | 75.4 | 70.9 | 67.0 | 44.0 | 39.4 | 36.0 | 25.5 |
| Cluster size | 346 | 299 | 207 | 208 | 152 | 187 | 121 | 116 | 136 | 86 | 83 | 59 |
| Average cluster RMSD | 1.5 | 1.8 | 1.9 | 2.0 | 1.9 | 2.5 | 1.7 | 1.7 | 3.1 | 2.2 | 2.3 | 2.3 |
| # | 1 | 2 | 3 | 4 | 5 | 6 | 7 | 8 | 9 | 10 | 11 | 12 |
| RMSD | 5.37 | 4.11 | 4.96 | 4.79 | 5.64 | 4.54 | 4.80 | 6.66 | 5.36 | 5.81 | 6.00 | 5.30 |
| GDT_TS | 0.58 | 0.60 | 0.59 | 0.58 | 0.61 | 0.60 | 0.63 | 0.61 | 0.59 | 0.58 | 0.57 | 0.58 |
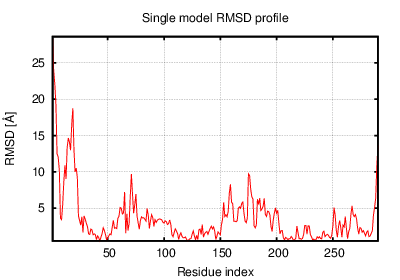
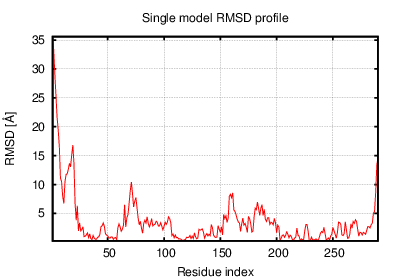
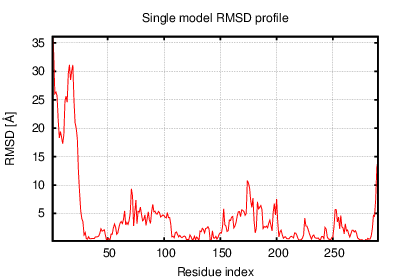
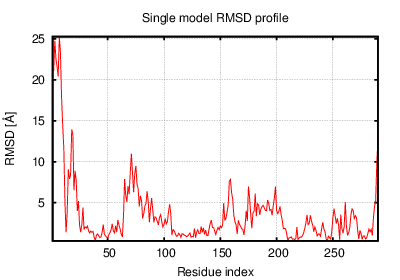
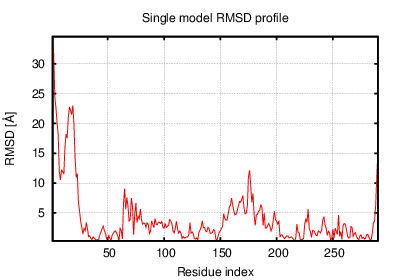
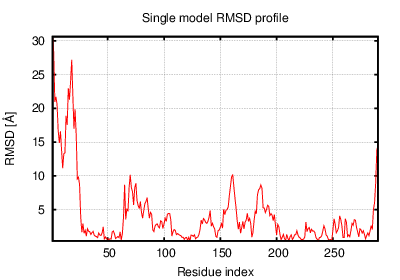
The table contains RMSD and GDT_TS values (calculated on the Cα atoms) between the predicted models and the input structure. Note that GDT_TS metric is intended as a more accurate measurement than the more common RMSD.
Read more about the root-mean-square deviation (RMSD) measure
Read more about the global distance test (GDT, also written as GDT_TS to represent "total score") measure.
| # | 1 | 2 | 3 | 4 | 5 | 6 | 7 | 8 | 9 | 10 | 11 | 12 |
| 1 | 0.00 | 4.38 | 2.92 | 5.85 | 6.59 | 2.93 | 5.67 | 8.14 | 3.66 | 7.38 | 7.25 | 3.09 |
| 2 | 4.38 | 0.00 | 3.17 | 4.02 | 4.70 | 3.64 | 3.92 | 6.01 | 4.65 | 5.25 | 4.63 | 3.92 |
| 3 | 2.92 | 3.17 | 0.00 | 5.41 | 6.11 | 2.65 | 5.18 | 7.47 | 3.98 | 6.69 | 6.37 | 2.32 |
| 4 | 5.85 | 4.02 | 5.41 | 0.00 | 3.64 | 5.36 | 3.01 | 4.36 | 6.24 | 3.22 | 4.30 | 6.03 |
| 5 | 6.59 | 4.70 | 6.11 | 3.64 | 0.00 | 6.35 | 2.58 | 4.97 | 6.59 | 4.39 | 4.51 | 6.67 |
| 6 | 2.93 | 3.64 | 2.65 | 5.36 | 6.35 | 0.00 | 5.40 | 7.73 | 3.04 | 6.81 | 6.68 | 3.09 |
| 7 | 5.67 | 3.92 | 5.18 | 3.01 | 2.58 | 5.40 | 0.00 | 5.39 | 6.01 | 4.41 | 4.91 | 5.87 |
| 8 | 8.14 | 6.01 | 7.47 | 4.36 | 4.97 | 7.73 | 5.39 | 0.00 | 8.26 | 2.69 | 3.68 | 8.11 |
| 9 | 3.66 | 4.65 | 3.98 | 6.24 | 6.59 | 3.04 | 6.01 | 8.26 | 0.00 | 7.68 | 7.19 | 4.11 |
| 10 | 7.38 | 5.25 | 6.69 | 3.22 | 4.39 | 6.81 | 4.41 | 2.69 | 7.68 | 0.00 | 4.02 | 7.36 |
| 11 | 7.25 | 4.63 | 6.37 | 4.30 | 4.51 | 6.68 | 4.91 | 3.68 | 7.19 | 4.02 | 0.00 | 7.10 |
| 12 | 3.09 | 3.92 | 2.32 | 6.03 | 6.67 | 3.09 | 5.87 | 8.11 | 4.11 | 7.36 | 7.10 | 0.00 |
The table contains RMSD values (calculated on the Cα atoms) between the predicted models.
Read more about the root-mean-square deviation (RMSD) measure.
| # | 1 | 2 | 3 | 4 | 5 | 6 | 7 | 8 | 9 | 10 | 11 | 12 |
| 1 | 1.00 | 0.61 | 0.63 | 0.61 | 0.63 | 0.66 | 0.65 | 0.58 | 0.68 | 0.56 | 0.59 | 0.64 |
| 2 | 0.61 | 1.00 | 0.76 | 0.59 | 0.66 | 0.66 | 0.65 | 0.57 | 0.66 | 0.56 | 0.67 | 0.76 |
| 3 | 0.63 | 0.76 | 1.00 | 0.59 | 0.63 | 0.68 | 0.66 | 0.58 | 0.63 | 0.55 | 0.68 | 0.81 |
| 4 | 0.61 | 0.59 | 0.59 | 1.00 | 0.64 | 0.63 | 0.68 | 0.64 | 0.64 | 0.68 | 0.62 | 0.59 |
| 5 | 0.63 | 0.66 | 0.63 | 0.64 | 1.00 | 0.62 | 0.73 | 0.59 | 0.64 | 0.58 | 0.69 | 0.65 |
| 6 | 0.66 | 0.66 | 0.68 | 0.63 | 0.62 | 1.00 | 0.66 | 0.56 | 0.76 | 0.59 | 0.62 | 0.66 |
| 7 | 0.65 | 0.65 | 0.66 | 0.68 | 0.73 | 0.66 | 1.00 | 0.64 | 0.68 | 0.60 | 0.67 | 0.67 |
| 8 | 0.58 | 0.57 | 0.58 | 0.64 | 0.59 | 0.56 | 0.64 | 1.00 | 0.57 | 0.72 | 0.60 | 0.57 |
| 9 | 0.68 | 0.66 | 0.63 | 0.64 | 0.64 | 0.76 | 0.68 | 0.57 | 1.00 | 0.58 | 0.60 | 0.64 |
| 10 | 0.56 | 0.56 | 0.55 | 0.68 | 0.58 | 0.59 | 0.60 | 0.72 | 0.58 | 1.00 | 0.59 | 0.54 |
| 11 | 0.59 | 0.67 | 0.68 | 0.62 | 0.69 | 0.62 | 0.67 | 0.60 | 0.60 | 0.59 | 1.00 | 0.66 |
| 12 | 0.64 | 0.76 | 0.81 | 0.59 | 0.65 | 0.66 | 0.67 | 0.57 | 0.64 | 0.54 | 0.66 | 1.00 |
The table contains GDT_TS values (calculated on the Cα atoms) between the predicted models.
Read more about the global distance test (GDT, also written as GDT_TS to represent "total score") measure.
© Laboratory of Theory of Biopolymers, Faculty of Chemistry, University of Warsaw 2013