Status: Done started: 2018-Jun-09 13:36:37 UTC
| Project Name | |
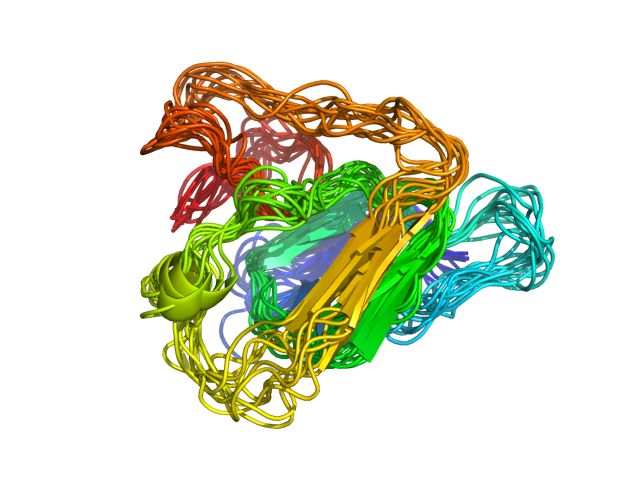
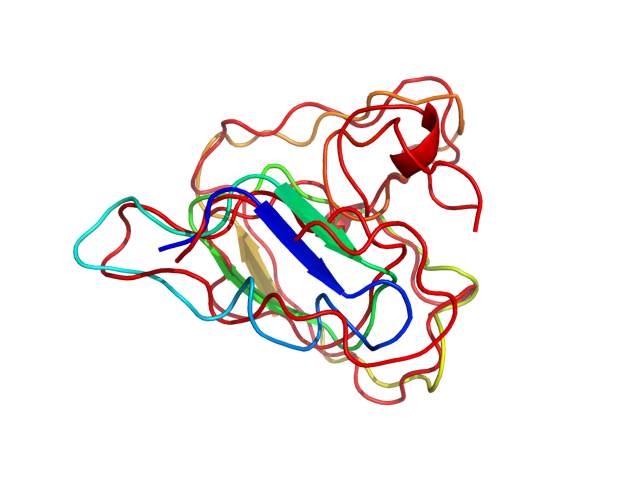
| Sequence | HFPRACVSSK NLMEKECCPP WSGNRSPCGQ LSGRGSCQNI LLSNAPLGPQ FPFTGVDDRE SWPSVFYNRT CQCSGNFMGF NCGNCKFGFW GPNCTE |
| Secondary structure | CCCEECCCCC CCCCCCCCCC CCCCCCCCCE ECCCCCCCCC CCCCCCCCCC CCHHHHCCCC CCCCCCCCCC CCCCCCCCCC CCCCCCCCCC CCCCCC |
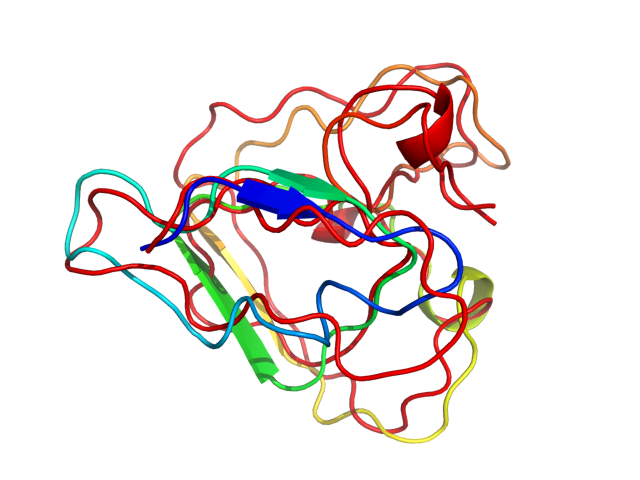
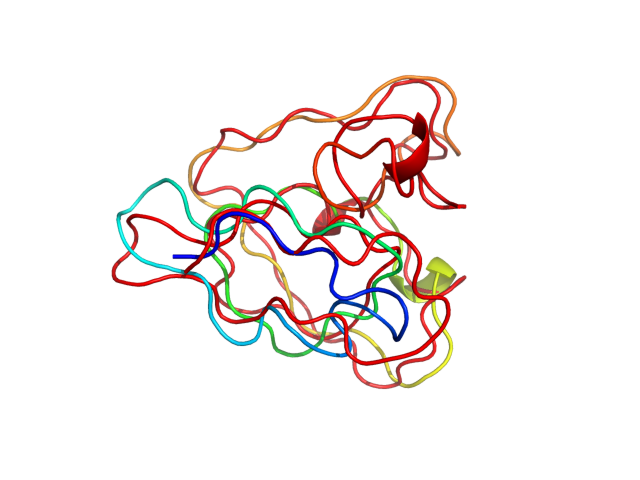
| Movie from predicted structures | To download the movie, right click on the desired file format:  
|
| Estimated finish time | 2018-Jun-09 18:08 UTC |
| Project Name |


| Project Name |
| Cluster # | 1 | 2 | 3 | 4 | 5 | 6 | 7 | 8 | 9 | 10 | 11 | 12 |
| Cluster density | 167.3 | 152.7 | 134.2 | 126.7 | 125.6 | 110.2 | 108.9 | 100.4 | 83.4 | 75.7 | 59.7 | 47.4 |
| Cluster size | 255 | 228 | 209 | 200 | 198 | 165 | 167 | 152 | 142 | 121 | 82 | 81 |
| Average cluster RMSD | 1.5 | 1.5 | 1.6 | 1.6 | 1.6 | 1.5 | 1.5 | 1.5 | 1.7 | 1.6 | 1.4 | 1.7 |
| # | 1 | 2 | 3 | 4 | 5 | 6 | 7 | 8 | 9 | 10 | 11 | 12 |
| RMSD | 2.99 | 2.56 | 3.09 | 3.24 | 2.97 | 2.80 | 2.81 | 2.96 | 3.01 | 2.69 | 2.51 | 2.97 |
| GDT_TS | 0.62 | 0.66 | 0.62 | 0.64 | 0.65 | 0.65 | 0.64 | 0.62 | 0.65 | 0.67 | 0.70 | 0.62 |
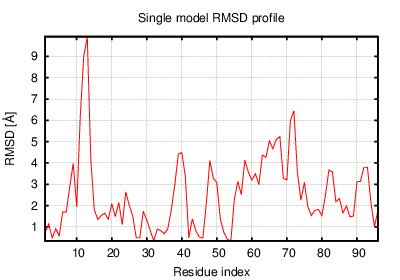
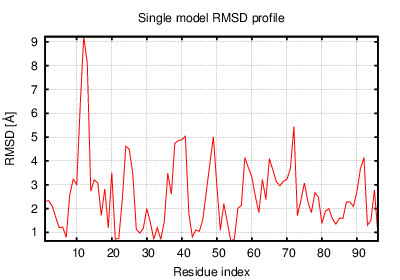
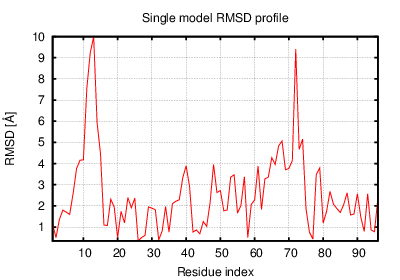
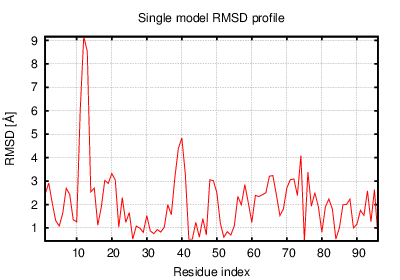
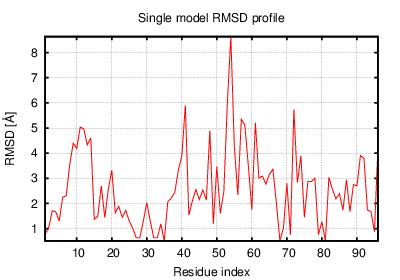
The table contains RMSD and GDT_TS values (calculated on the Cα atoms) between the predicted models and the input structure. Note that GDT_TS metric is intended as a more accurate measurement than the more common RMSD.
Read more about the root-mean-square deviation (RMSD) measure
Read more about the global distance test (GDT, also written as GDT_TS to represent "total score") measure.
| # | 1 | 2 | 3 | 4 | 5 | 6 | 7 | 8 | 9 | 10 | 11 | 12 |
| 1 | 0.00 | 2.31 | 1.94 | 2.21 | 2.15 | 2.44 | 2.41 | 2.21 | 1.95 | 2.17 | 2.34 | 3.32 |
| 2 | 2.31 | 0.00 | 2.76 | 2.49 | 2.27 | 2.14 | 2.16 | 2.35 | 2.48 | 2.09 | 1.95 | 3.08 |
| 3 | 1.94 | 2.76 | 0.00 | 2.66 | 2.58 | 2.62 | 2.67 | 2.42 | 2.58 | 2.48 | 2.48 | 3.52 |
| 4 | 2.21 | 2.49 | 2.66 | 0.00 | 2.48 | 2.58 | 2.59 | 2.48 | 2.03 | 2.40 | 2.96 | 3.49 |
| 5 | 2.15 | 2.27 | 2.58 | 2.48 | 0.00 | 2.77 | 2.25 | 2.15 | 2.06 | 2.23 | 2.17 | 3.69 |
| 6 | 2.44 | 2.14 | 2.62 | 2.58 | 2.77 | 0.00 | 2.72 | 2.35 | 2.69 | 2.43 | 2.67 | 2.91 |
| 7 | 2.41 | 2.16 | 2.67 | 2.59 | 2.25 | 2.72 | 0.00 | 2.45 | 2.61 | 2.27 | 2.32 | 3.34 |
| 8 | 2.21 | 2.35 | 2.42 | 2.48 | 2.15 | 2.35 | 2.45 | 0.00 | 2.40 | 2.19 | 2.48 | 3.40 |
| 9 | 1.95 | 2.48 | 2.58 | 2.03 | 2.06 | 2.69 | 2.61 | 2.40 | 0.00 | 2.34 | 2.58 | 3.57 |
| 10 | 2.17 | 2.09 | 2.48 | 2.40 | 2.23 | 2.43 | 2.27 | 2.19 | 2.34 | 0.00 | 2.26 | 3.19 |
| 11 | 2.34 | 1.95 | 2.48 | 2.96 | 2.17 | 2.67 | 2.32 | 2.48 | 2.58 | 2.26 | 0.00 | 3.41 |
| 12 | 3.32 | 3.08 | 3.52 | 3.49 | 3.69 | 2.91 | 3.34 | 3.40 | 3.57 | 3.19 | 3.41 | 0.00 |
The table contains RMSD values (calculated on the Cα atoms) between the predicted models.
Read more about the root-mean-square deviation (RMSD) measure.
| # | 1 | 2 | 3 | 4 | 5 | 6 | 7 | 8 | 9 | 10 | 11 | 12 |
| 1 | 1.00 | 0.71 | 0.77 | 0.72 | 0.70 | 0.67 | 0.69 | 0.71 | 0.74 | 0.74 | 0.70 | 0.61 |
| 2 | 0.71 | 1.00 | 0.68 | 0.67 | 0.73 | 0.72 | 0.72 | 0.69 | 0.69 | 0.73 | 0.77 | 0.67 |
| 3 | 0.77 | 0.68 | 1.00 | 0.68 | 0.66 | 0.67 | 0.67 | 0.69 | 0.67 | 0.70 | 0.69 | 0.59 |
| 4 | 0.72 | 0.67 | 0.68 | 1.00 | 0.68 | 0.64 | 0.65 | 0.67 | 0.76 | 0.69 | 0.61 | 0.62 |
| 5 | 0.70 | 0.73 | 0.66 | 0.68 | 1.00 | 0.64 | 0.72 | 0.70 | 0.74 | 0.75 | 0.73 | 0.59 |
| 6 | 0.67 | 0.72 | 0.67 | 0.64 | 0.64 | 1.00 | 0.62 | 0.71 | 0.66 | 0.68 | 0.66 | 0.68 |
| 7 | 0.69 | 0.72 | 0.67 | 0.65 | 0.72 | 0.62 | 1.00 | 0.67 | 0.64 | 0.70 | 0.70 | 0.61 |
| 8 | 0.71 | 0.69 | 0.69 | 0.67 | 0.70 | 0.71 | 0.67 | 1.00 | 0.68 | 0.70 | 0.68 | 0.60 |
| 9 | 0.74 | 0.69 | 0.67 | 0.76 | 0.74 | 0.66 | 0.64 | 0.68 | 1.00 | 0.69 | 0.66 | 0.60 |
| 10 | 0.74 | 0.73 | 0.70 | 0.69 | 0.75 | 0.68 | 0.70 | 0.70 | 0.69 | 1.00 | 0.70 | 0.65 |
| 11 | 0.70 | 0.77 | 0.69 | 0.61 | 0.73 | 0.66 | 0.70 | 0.68 | 0.66 | 0.70 | 1.00 | 0.61 |
| 12 | 0.61 | 0.67 | 0.59 | 0.62 | 0.59 | 0.68 | 0.61 | 0.60 | 0.60 | 0.65 | 0.61 | 1.00 |
The table contains GDT_TS values (calculated on the Cα atoms) between the predicted models.
Read more about the global distance test (GDT, also written as GDT_TS to represent "total score") measure.
© Laboratory of Theory of Biopolymers, Faculty of Chemistry, University of Warsaw 2013