Status: Done started: 2018-Jul-25 12:53:14 UTC
| Project Name | |
| Sequence | MGEMEQLRQE AEQLKKQIAD ARKACADVTL AELVSGLEVV GRVQMRTRRT LRGHLAKIYA MHWATDSKLL VSASQDGKLI VWDSYTTNKV HAIPLRSSWV MTCAYAPSGN FVACGGLDNM CSIYNLKSRE GNVKVSRELS AHTGYLSCCR FLDDNNIVTS SGDTTCALWD IETGQQKTVF VGHTGDCMSL AVSPDFNLFI SGACDASAKL WDVREGTCRQ TFTGHESDIN AICFFPNGEA ICTGSDDASC RLFDLRADQE LICFSHESII CSITSVAFSL SGRLLFAGYD DFNCNVWDSM KSERVGILSG HDNRVSCLGV TADGMAVATG SWDSFLKIWN |
| Secondary structure | CHHHHHHHHH HHHHHHHHHH HHHHHCCCCH HHHCCCCCCC CCCCCCEEEE ECCCCCCEEE EEECCCCCEE EEEECCCEEE EEECCCCEEE EEEECCCCCE EEEEECCCCC EEEEEECCCE EEEEECCCCC CCCCEEEEEE CCCCCEEEEE EEECCEEEEE ECCCEEEEEE CCCCCEEEEE ECCCCCEEEE EECCCCCEEE EEECCCEEEE EECCCCEEEE EECCCCCCEE EEEECCCCCE EEEEECCCCE EEEECCCCEE EEEECCCCCC CCEEEEEECC CCCEEEEEEC CCEEEEEECC CCCCCEEEEC CCCCEEEEEE CCCCCCEEEE ECCCCEEEEC |
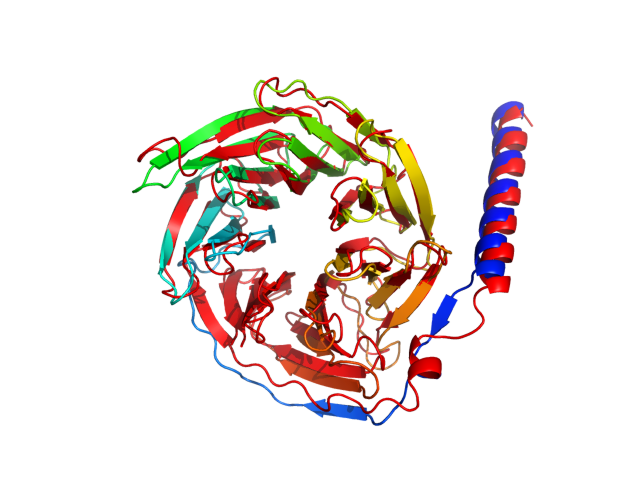
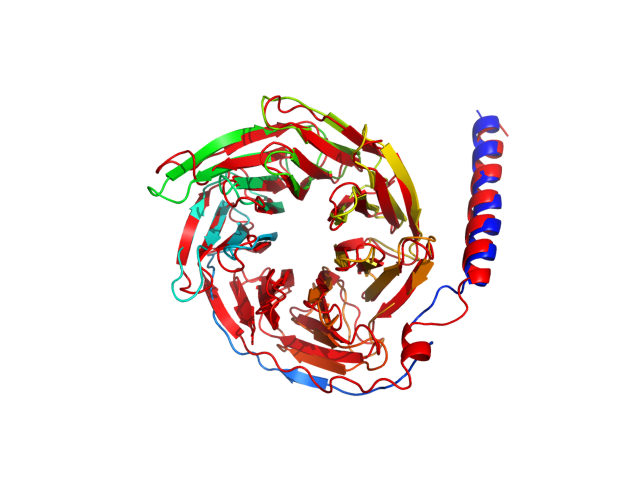
| Movie from predicted structures | To download the movie, right click on the desired file format:  
|
| Estimated finish time | 2018-Jul-25 17:57 UTC |
| Project Name |


| Project Name |
| Cluster # | 1 | 2 | 3 | 4 | 5 | 6 | 7 | 8 | 9 | 10 | 11 | 12 |
| Cluster density | 251.8 | 212.0 | 191.8 | 188.3 | 166.2 | 158.8 | 137.6 | 130.3 | 120.1 | 106.0 | 98.1 | 96.6 |
| Cluster size | 280 | 224 | 201 | 209 | 179 | 168 | 146 | 134 | 148 | 112 | 102 | 97 |
| Average cluster RMSD | 1.1 | 1.1 | 1.0 | 1.1 | 1.1 | 1.1 | 1.1 | 1.0 | 1.2 | 1.1 | 1.0 | 1.0 |
| # | 1 | 2 | 3 | 4 | 5 | 6 | 7 | 8 | 9 | 10 | 11 | 12 |
| RMSD | 3.27 | 3.29 | 3.02 | 3.08 | 2.95 | 2.96 | 3.14 | 3.24 | 2.98 | 2.98 | 2.82 | 2.89 |
| GDT_TS | 0.64 | 0.65 | 0.68 | 0.66 | 0.66 | 0.67 | 0.68 | 0.66 | 0.66 | 0.67 | 0.69 | 0.70 |
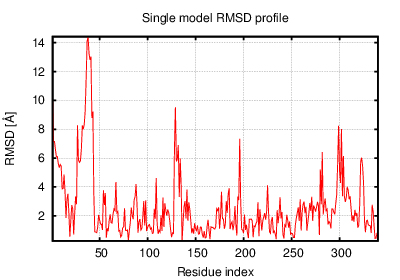
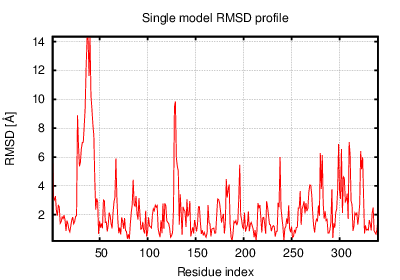
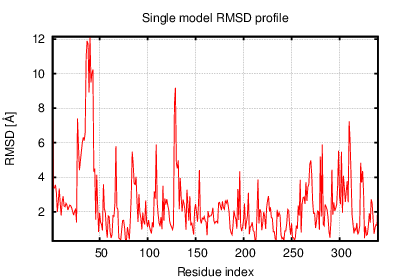
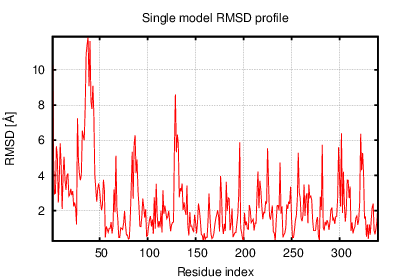
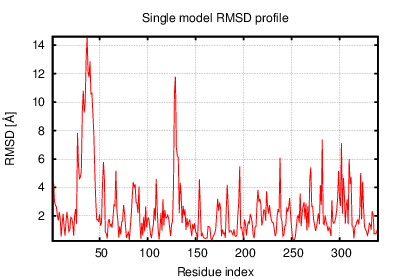
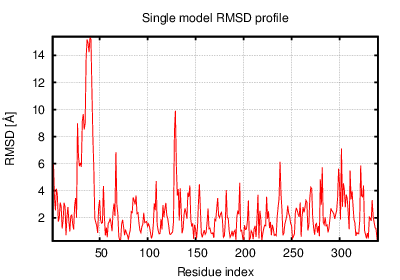
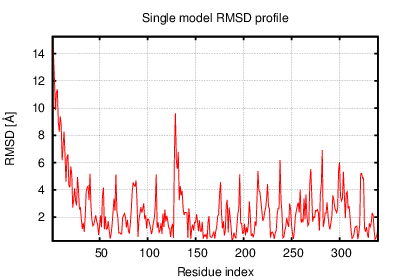
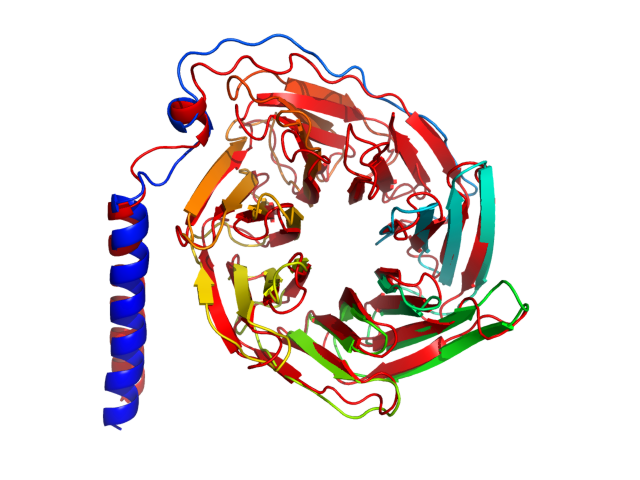
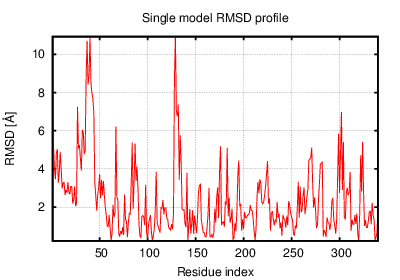
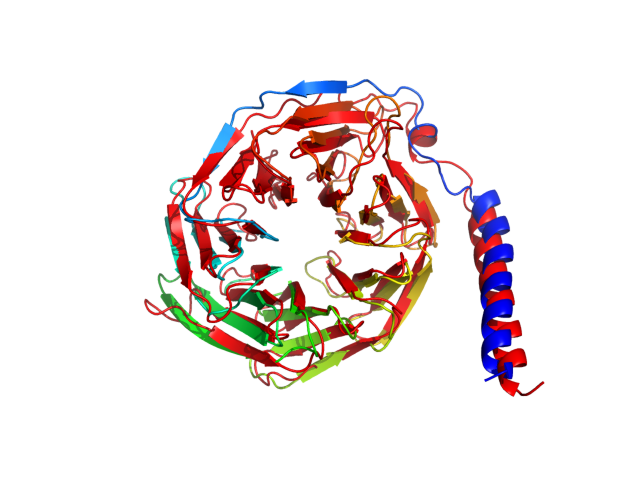
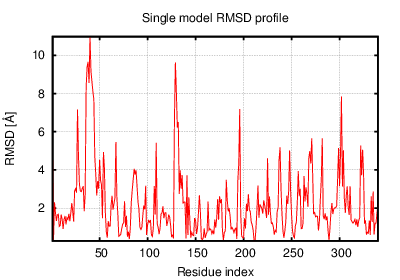
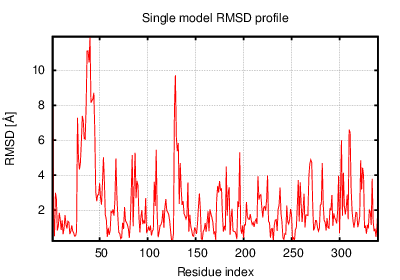
The table contains RMSD and GDT_TS values (calculated on the Cα atoms) between the predicted models and the input structure. Note that GDT_TS metric is intended as a more accurate measurement than the more common RMSD.
Read more about the root-mean-square deviation (RMSD) measure
Read more about the global distance test (GDT, also written as GDT_TS to represent "total score") measure.
| # | 1 | 2 | 3 | 4 | 5 | 6 | 7 | 8 | 9 | 10 | 11 | 12 |
| 1 | 0.00 | 1.99 | 2.23 | 2.43 | 2.06 | 2.82 | 2.54 | 2.44 | 2.17 | 2.96 | 2.53 | 2.43 |
| 2 | 1.99 | 0.00 | 1.99 | 2.27 | 2.00 | 2.42 | 2.30 | 2.02 | 2.67 | 2.63 | 2.35 | 2.20 |
| 3 | 2.23 | 1.99 | 0.00 | 1.76 | 1.56 | 2.21 | 1.61 | 1.77 | 2.94 | 2.37 | 2.09 | 1.80 |
| 4 | 2.43 | 2.27 | 1.76 | 0.00 | 1.83 | 2.05 | 1.58 | 2.14 | 3.12 | 2.28 | 1.81 | 1.75 |
| 5 | 2.06 | 2.00 | 1.56 | 1.83 | 0.00 | 2.19 | 1.90 | 1.87 | 2.77 | 2.40 | 2.03 | 1.95 |
| 6 | 2.82 | 2.42 | 2.21 | 2.05 | 2.19 | 0.00 | 2.24 | 2.50 | 3.26 | 1.90 | 1.74 | 1.68 |
| 7 | 2.54 | 2.30 | 1.61 | 1.58 | 1.90 | 2.24 | 0.00 | 1.84 | 3.28 | 2.38 | 2.00 | 1.85 |
| 8 | 2.44 | 2.02 | 1.77 | 2.14 | 1.87 | 2.50 | 1.84 | 0.00 | 3.13 | 2.69 | 2.23 | 2.18 |
| 9 | 2.17 | 2.67 | 2.94 | 3.12 | 2.77 | 3.26 | 3.28 | 3.13 | 0.00 | 3.33 | 3.05 | 3.04 |
| 10 | 2.96 | 2.63 | 2.37 | 2.28 | 2.40 | 1.90 | 2.38 | 2.69 | 3.33 | 0.00 | 2.26 | 1.85 |
| 11 | 2.53 | 2.35 | 2.09 | 1.81 | 2.03 | 1.74 | 2.00 | 2.23 | 3.05 | 2.26 | 0.00 | 1.82 |
| 12 | 2.43 | 2.20 | 1.80 | 1.75 | 1.95 | 1.68 | 1.85 | 2.18 | 3.04 | 1.85 | 1.82 | 0.00 |
The table contains RMSD values (calculated on the Cα atoms) between the predicted models.
Read more about the root-mean-square deviation (RMSD) measure.
| # | 1 | 2 | 3 | 4 | 5 | 6 | 7 | 8 | 9 | 10 | 11 | 12 |
| 1 | 1.00 | 0.78 | 0.74 | 0.76 | 0.75 | 0.73 | 0.76 | 0.72 | 0.75 | 0.70 | 0.75 | 0.73 |
| 2 | 0.78 | 1.00 | 0.77 | 0.74 | 0.74 | 0.74 | 0.76 | 0.75 | 0.72 | 0.71 | 0.72 | 0.72 |
| 3 | 0.74 | 0.77 | 1.00 | 0.78 | 0.81 | 0.74 | 0.83 | 0.80 | 0.70 | 0.72 | 0.75 | 0.76 |
| 4 | 0.76 | 0.74 | 0.78 | 1.00 | 0.79 | 0.77 | 0.82 | 0.74 | 0.68 | 0.73 | 0.78 | 0.76 |
| 5 | 0.75 | 0.74 | 0.81 | 0.79 | 1.00 | 0.75 | 0.78 | 0.78 | 0.71 | 0.72 | 0.76 | 0.75 |
| 6 | 0.73 | 0.74 | 0.74 | 0.77 | 0.75 | 1.00 | 0.75 | 0.72 | 0.72 | 0.78 | 0.81 | 0.82 |
| 7 | 0.76 | 0.76 | 0.83 | 0.82 | 0.78 | 0.75 | 1.00 | 0.79 | 0.71 | 0.73 | 0.77 | 0.76 |
| 8 | 0.72 | 0.75 | 0.80 | 0.74 | 0.78 | 0.72 | 0.79 | 1.00 | 0.71 | 0.70 | 0.73 | 0.72 |
| 9 | 0.75 | 0.72 | 0.70 | 0.68 | 0.71 | 0.72 | 0.71 | 0.71 | 1.00 | 0.67 | 0.72 | 0.70 |
| 10 | 0.70 | 0.71 | 0.72 | 0.73 | 0.72 | 0.78 | 0.73 | 0.70 | 0.67 | 1.00 | 0.77 | 0.79 |
| 11 | 0.75 | 0.72 | 0.75 | 0.78 | 0.76 | 0.81 | 0.77 | 0.73 | 0.72 | 0.77 | 1.00 | 0.80 |
| 12 | 0.73 | 0.72 | 0.76 | 0.76 | 0.75 | 0.82 | 0.76 | 0.72 | 0.70 | 0.79 | 0.80 | 1.00 |
The table contains GDT_TS values (calculated on the Cα atoms) between the predicted models.
Read more about the global distance test (GDT, also written as GDT_TS to represent "total score") measure.
© Laboratory of Theory of Biopolymers, Faculty of Chemistry, University of Warsaw 2013