Status: Done started: 2018-Aug-01 23:10:39 UTC
| Project Name | |
| Sequence | NDCIFEVKHE GKVTGYACLV GDKVMKPAHV KGTIDNADLA KLAFKRSSKY DLECAQIPVH MKSDASKFTH EKPEGYYNWH HGAVQYSGGR FTIPTGAGKP GDSGRPIFDN KGRVVAIVLG GANEGARTAL SVVTWNKDIV TKITPEGAEE W |
| Secondary structure | CCCEEEEEEC CEEEEEEEEE CCEEEEECCC CCEECCHHHH CCCCEEECCC CEEEEECCCC CCCCCCCCCC CCCCEEEEEC CEEEEEECCE EEEECCCCCC CCCCCEEECC CCCEEEEEEE EEECCCEEEE EEEEEECCEE EEECCCCCEE C |
| Movie from predicted structures | To download the movie, right click on the desired file format:  
|
| Estimated finish time | 2018-Aug-02 03:49 UTC |
| Project Name |


| Project Name |
| Cluster # | 1 | 2 | 3 | 4 | 5 | 6 | 7 | 8 | 9 | 10 | 11 | 12 |
| Cluster density | 184.2 | 159.9 | 155.6 | 145.2 | 140.3 | 137.5 | 135.1 | 125.2 | 120.5 | 120.1 | 106.5 | 47.4 |
| Cluster size | 232 | 212 | 189 | 194 | 180 | 173 | 157 | 158 | 151 | 152 | 143 | 59 |
| Average cluster RMSD | 1.3 | 1.3 | 1.2 | 1.3 | 1.3 | 1.3 | 1.2 | 1.3 | 1.3 | 1.3 | 1.3 | 1.2 |
| # | 1 | 2 | 3 | 4 | 5 | 6 | 7 | 8 | 9 | 10 | 11 | 12 |
| RMSD | 2.56 | 2.58 | 2.70 | 2.64 | 2.76 | 2.78 | 2.84 | 2.60 | 2.80 | 2.48 | 2.60 | 2.67 |
| GDT_TS | 0.69 | 0.68 | 0.64 | 0.67 | 0.67 | 0.67 | 0.67 | 0.68 | 0.64 | 0.71 | 0.67 | 0.69 |
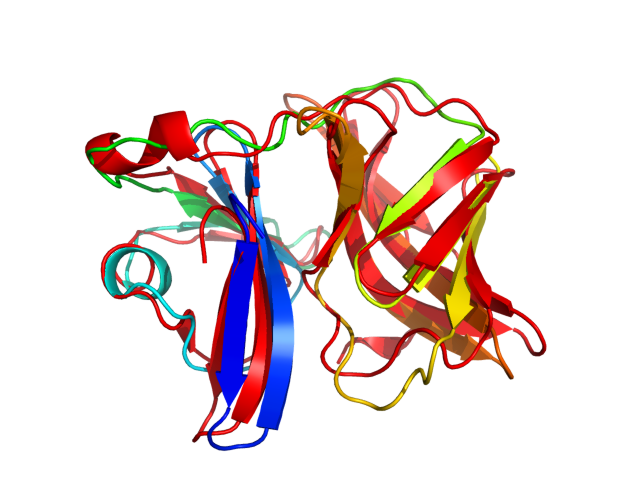
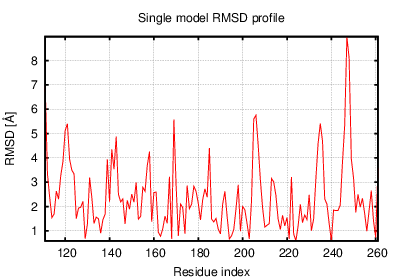
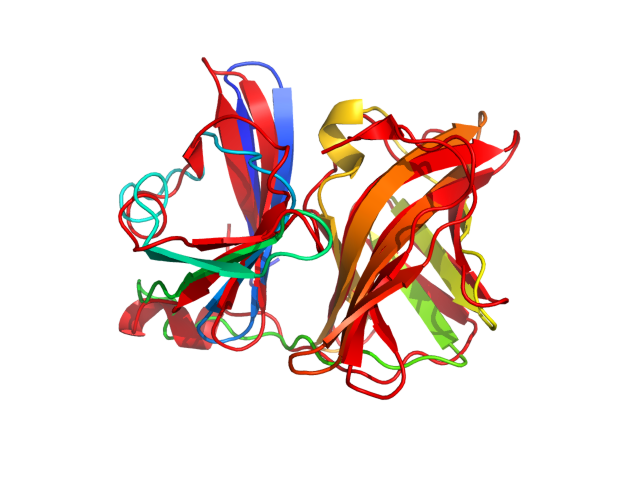
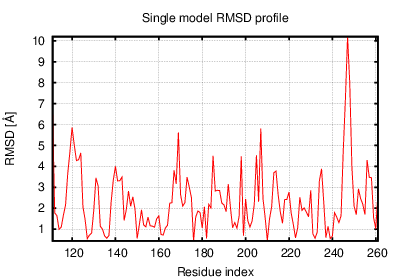
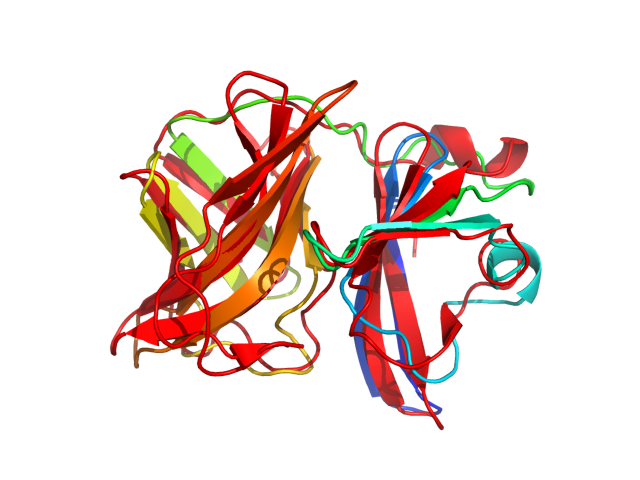
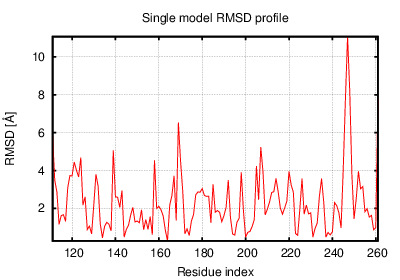
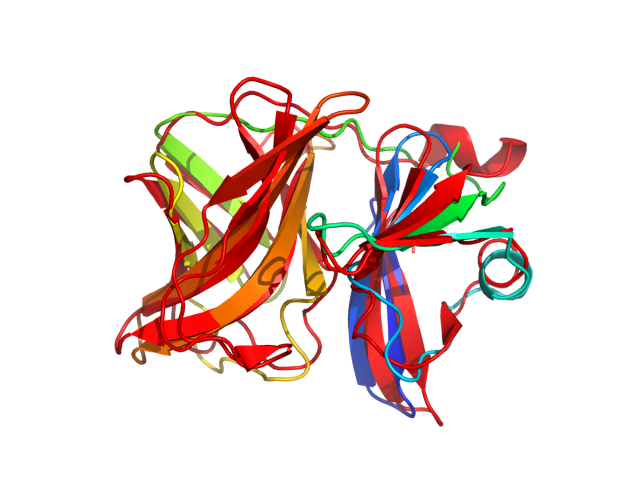
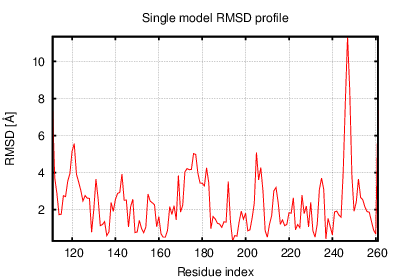
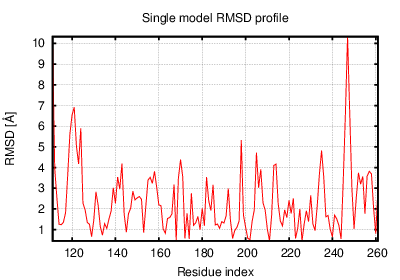
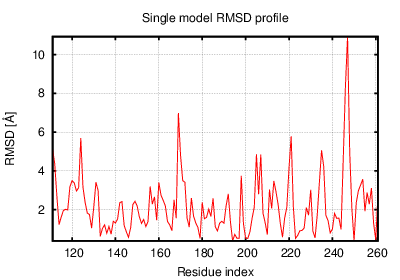
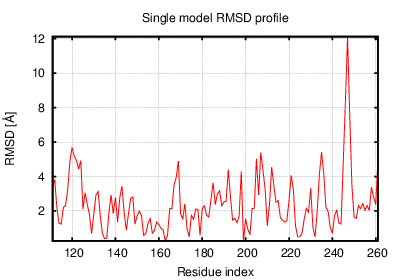
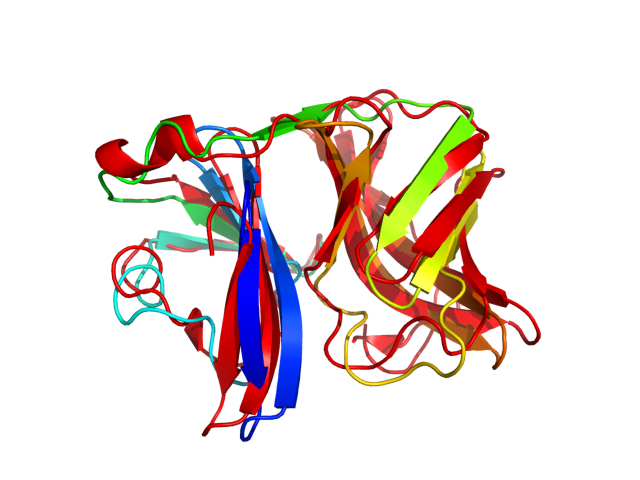
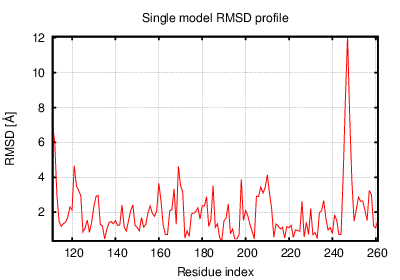
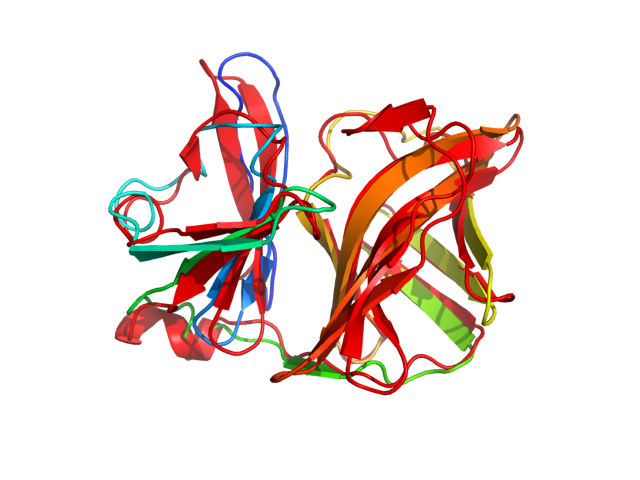
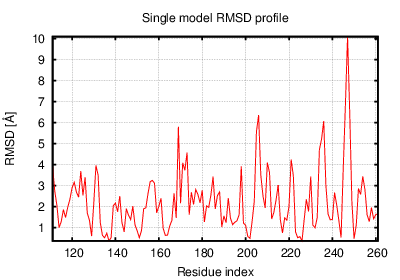
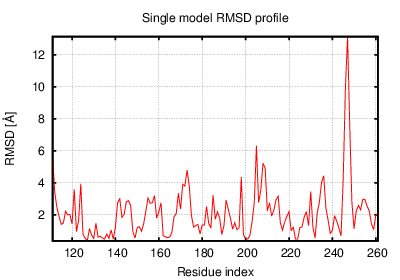
The table contains RMSD and GDT_TS values (calculated on the Cα atoms) between the predicted models and the input structure. Note that GDT_TS metric is intended as a more accurate measurement than the more common RMSD.
Read more about the root-mean-square deviation (RMSD) measure
Read more about the global distance test (GDT, also written as GDT_TS to represent "total score") measure.
| # | 1 | 2 | 3 | 4 | 5 | 6 | 7 | 8 | 9 | 10 | 11 | 12 |
| 1 | 0.00 | 1.63 | 1.78 | 1.80 | 1.90 | 1.62 | 1.97 | 2.06 | 2.00 | 2.06 | 1.99 | 2.05 |
| 2 | 1.63 | 0.00 | 1.71 | 2.00 | 1.89 | 1.71 | 1.92 | 1.58 | 1.89 | 2.12 | 1.67 | 2.00 |
| 3 | 1.78 | 1.71 | 0.00 | 1.94 | 1.68 | 1.92 | 1.72 | 1.86 | 1.96 | 2.09 | 1.86 | 2.12 |
| 4 | 1.80 | 2.00 | 1.94 | 0.00 | 1.87 | 1.88 | 1.79 | 1.95 | 1.87 | 2.23 | 2.19 | 2.29 |
| 5 | 1.90 | 1.89 | 1.68 | 1.87 | 0.00 | 1.79 | 1.78 | 1.75 | 1.75 | 2.07 | 2.05 | 2.16 |
| 6 | 1.62 | 1.71 | 1.92 | 1.88 | 1.79 | 0.00 | 2.00 | 2.00 | 1.90 | 2.23 | 1.88 | 2.39 |
| 7 | 1.97 | 1.92 | 1.72 | 1.79 | 1.78 | 2.00 | 0.00 | 1.75 | 1.92 | 2.05 | 2.21 | 2.36 |
| 8 | 2.06 | 1.58 | 1.86 | 1.95 | 1.75 | 2.00 | 1.75 | 0.00 | 1.85 | 2.10 | 1.75 | 2.15 |
| 9 | 2.00 | 1.89 | 1.96 | 1.87 | 1.75 | 1.90 | 1.92 | 1.85 | 0.00 | 2.13 | 1.90 | 2.26 |
| 10 | 2.06 | 2.12 | 2.09 | 2.23 | 2.07 | 2.23 | 2.05 | 2.10 | 2.13 | 0.00 | 2.02 | 2.10 |
| 11 | 1.99 | 1.67 | 1.86 | 2.19 | 2.05 | 1.88 | 2.21 | 1.75 | 1.90 | 2.02 | 0.00 | 2.10 |
| 12 | 2.05 | 2.00 | 2.12 | 2.29 | 2.16 | 2.39 | 2.36 | 2.15 | 2.26 | 2.10 | 2.10 | 0.00 |
The table contains RMSD values (calculated on the Cα atoms) between the predicted models.
Read more about the root-mean-square deviation (RMSD) measure.
| # | 1 | 2 | 3 | 4 | 5 | 6 | 7 | 8 | 9 | 10 | 11 | 12 |
| 1 | 1.00 | 0.84 | 0.79 | 0.78 | 0.82 | 0.84 | 0.79 | 0.77 | 0.76 | 0.76 | 0.77 | 0.75 |
| 2 | 0.84 | 1.00 | 0.79 | 0.77 | 0.78 | 0.82 | 0.79 | 0.82 | 0.76 | 0.76 | 0.79 | 0.76 |
| 3 | 0.79 | 0.79 | 1.00 | 0.78 | 0.81 | 0.79 | 0.81 | 0.78 | 0.75 | 0.72 | 0.78 | 0.73 |
| 4 | 0.78 | 0.77 | 0.78 | 1.00 | 0.78 | 0.79 | 0.80 | 0.77 | 0.77 | 0.73 | 0.74 | 0.71 |
| 5 | 0.82 | 0.78 | 0.81 | 0.78 | 1.00 | 0.82 | 0.80 | 0.81 | 0.79 | 0.76 | 0.78 | 0.73 |
| 6 | 0.84 | 0.82 | 0.79 | 0.79 | 0.82 | 1.00 | 0.78 | 0.78 | 0.77 | 0.72 | 0.79 | 0.72 |
| 7 | 0.79 | 0.79 | 0.81 | 0.80 | 0.80 | 0.78 | 1.00 | 0.85 | 0.78 | 0.75 | 0.76 | 0.73 |
| 8 | 0.77 | 0.82 | 0.78 | 0.77 | 0.81 | 0.78 | 0.85 | 1.00 | 0.77 | 0.74 | 0.78 | 0.75 |
| 9 | 0.76 | 0.76 | 0.75 | 0.77 | 0.79 | 0.77 | 0.78 | 0.77 | 1.00 | 0.74 | 0.79 | 0.71 |
| 10 | 0.76 | 0.76 | 0.72 | 0.73 | 0.76 | 0.72 | 0.75 | 0.74 | 0.74 | 1.00 | 0.75 | 0.74 |
| 11 | 0.77 | 0.79 | 0.78 | 0.74 | 0.78 | 0.79 | 0.76 | 0.78 | 0.79 | 0.75 | 1.00 | 0.79 |
| 12 | 0.75 | 0.76 | 0.73 | 0.71 | 0.73 | 0.72 | 0.73 | 0.75 | 0.71 | 0.74 | 0.79 | 1.00 |
The table contains GDT_TS values (calculated on the Cα atoms) between the predicted models.
Read more about the global distance test (GDT, also written as GDT_TS to represent "total score") measure.
© Laboratory of Theory of Biopolymers, Faculty of Chemistry, University of Warsaw 2013