Status: Done started: 2018-Aug-12 18:52:31 UTC
| Project Name | |
| Sequence | FARKTVGLPF PPRVNSDIEV EESEAVSVVQ HWLNKTEEEA SRSIREKMSI NDSPTHGHDI HVTRDLVKHH LSKSDMLTDP SQEVLEERTR IQFIRWSHTR IFQVPSEVMD DVMQERIDQV RRSVSHLMCD SYNDPSFRTS CSEC |
| Secondary structure | CCCCCCCCCC CCCCCCCCCC CCCCCCCCCC CCCCCCCCCC CCCCCCCCCC CHHHHHHHHH HHHHHHHHHH CCCCCCCCCC CCCCCCCCCC CCCCCCCCCC CCCCCCCCCC CCCCCCCCCC CCCCCCCCCC CCCCCCCCCC CCCC |
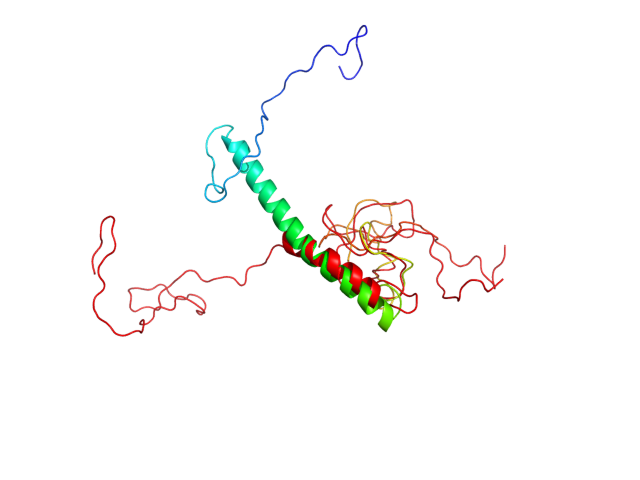
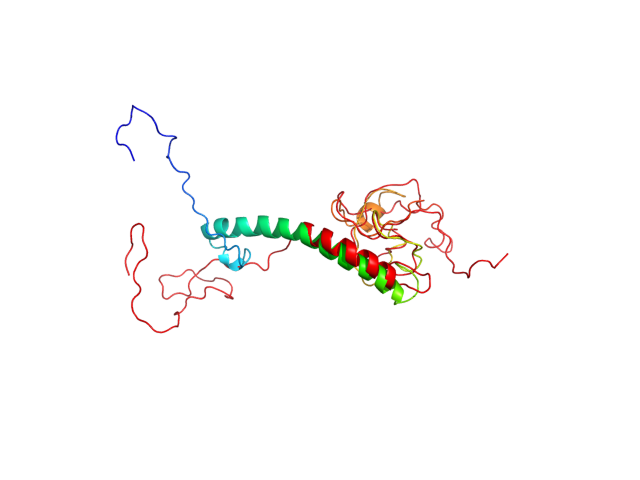
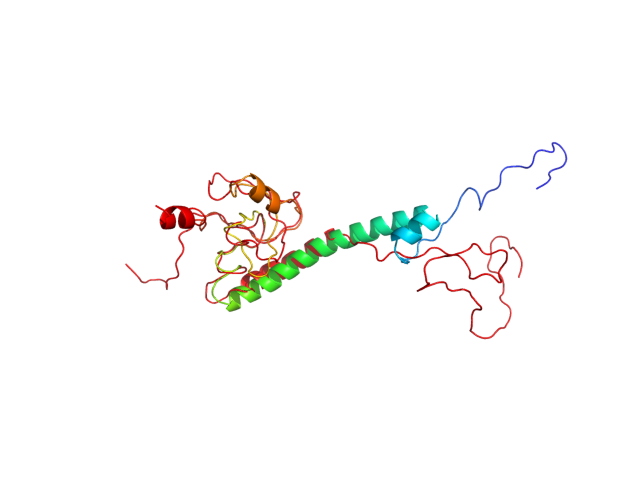
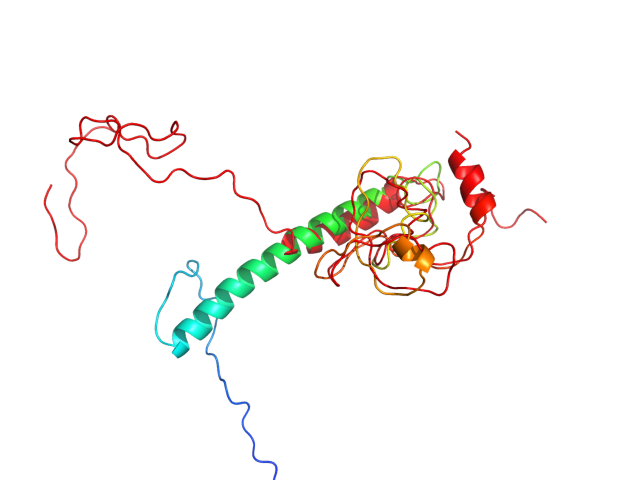
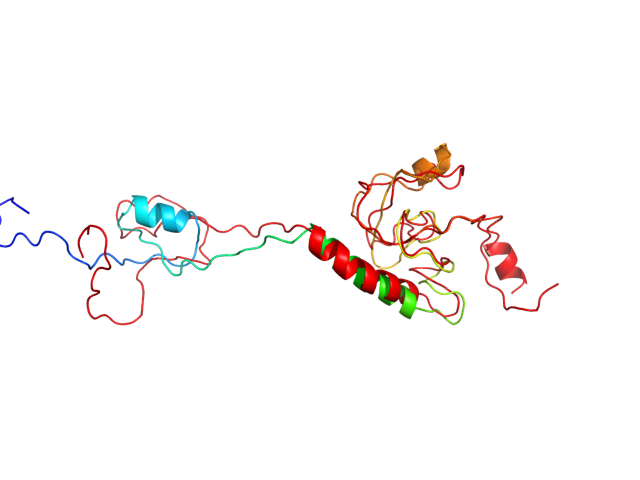
| Movie from predicted structures | To download the movie, right click on the desired file format:  
|
| Estimated finish time | 2018-Aug-12 23:30 UTC |
| Project Name |
| Project Name |
| Cluster # | 1 | 2 | 3 | 4 | 5 | 6 | 7 | 8 | 9 | 10 | 11 | 12 |
| Cluster density | 78.0 | 72.9 | 63.5 | 57.0 | 51.9 | 46.9 | 46.4 | 39.7 | 35.9 | 35.6 | 33.9 | 27.1 |
| Cluster size | 267 | 256 | 226 | 195 | 158 | 152 | 206 | 103 | 121 | 109 | 121 | 86 |
| Average cluster RMSD | 3.4 | 3.5 | 3.6 | 3.4 | 3.0 | 3.2 | 4.4 | 2.6 | 3.4 | 3.1 | 3.6 | 3.2 |
| # | 1 | 2 | 3 | 4 | 5 | 6 | 7 | 8 | 9 | 10 | 11 | 12 |
| RMSD | 13.00 | 13.80 | 10.80 | 11.90 | 10.40 | 15.20 | 11.20 | 10.20 | 13.60 | 11.20 | 12.40 | 9.16 |
| GDT_TS | 0.38 | 0.37 | 0.39 | 0.37 | 0.40 | 0.35 | 0.37 | 0.36 | 0.36 | 0.37 | 0.40 | 0.43 |
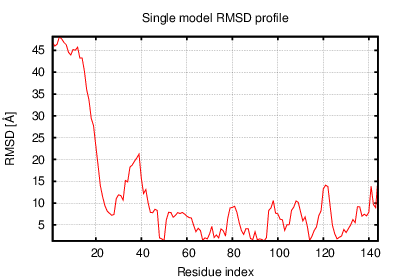
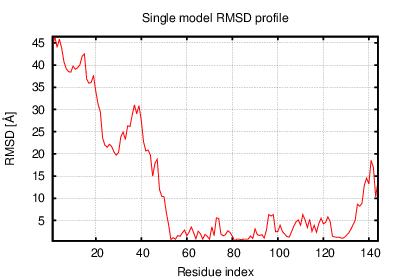
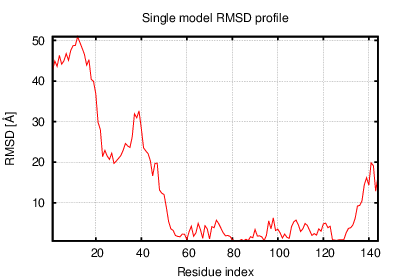
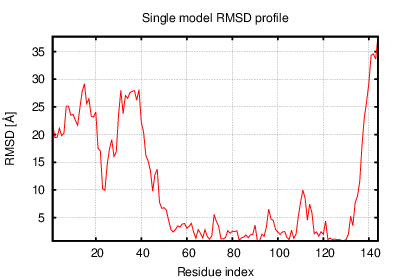
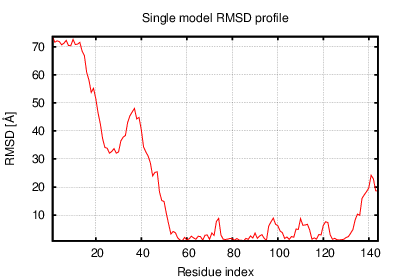
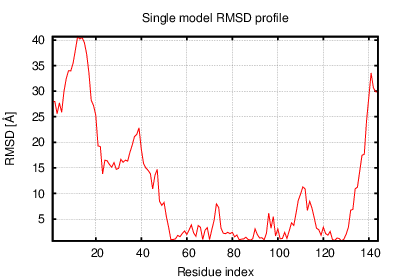
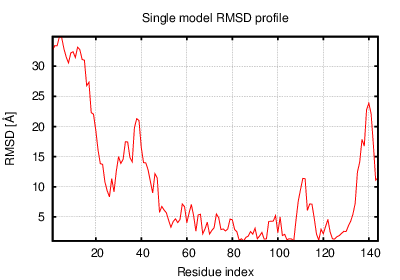
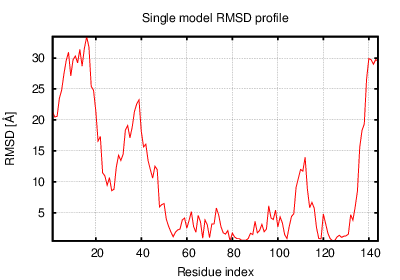
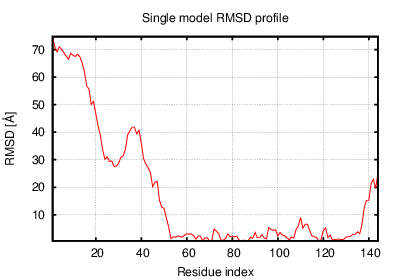
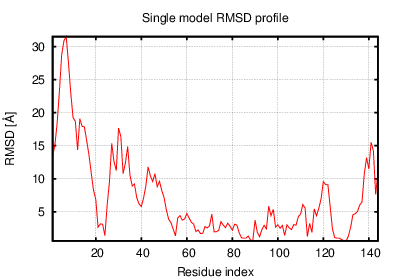
The table contains RMSD and GDT_TS values (calculated on the Cα atoms) between the predicted models and the input structure. Note that GDT_TS metric is intended as a more accurate measurement than the more common RMSD.
Read more about the root-mean-square deviation (RMSD) measure
Read more about the global distance test (GDT, also written as GDT_TS to represent "total score") measure.
| # | 1 | 2 | 3 | 4 | 5 | 6 | 7 | 8 | 9 | 10 | 11 | 12 |
| 1 | 0.00 | 4.81 | 5.71 | 5.76 | 12.30 | 5.67 | 9.76 | 6.68 | 4.01 | 12.30 | 4.56 | 16.50 |
| 2 | 4.81 | 0.00 | 5.48 | 5.17 | 13.10 | 7.58 | 11.70 | 7.75 | 6.57 | 13.70 | 7.50 | 17.20 |
| 3 | 5.71 | 5.48 | 0.00 | 4.58 | 10.70 | 7.73 | 9.18 | 4.91 | 7.39 | 11.20 | 6.97 | 14.10 |
| 4 | 5.76 | 5.17 | 4.58 | 0.00 | 11.40 | 7.98 | 9.88 | 5.61 | 7.16 | 11.90 | 7.85 | 15.30 |
| 5 | 12.30 | 13.10 | 10.70 | 11.40 | 0.00 | 13.60 | 7.20 | 9.90 | 13.90 | 6.13 | 12.20 | 8.33 |
| 6 | 5.67 | 7.58 | 7.73 | 7.98 | 13.60 | 0.00 | 10.80 | 8.87 | 5.56 | 13.30 | 6.42 | 18.00 |
| 7 | 9.76 | 11.70 | 9.18 | 9.88 | 7.20 | 10.80 | 0.00 | 7.92 | 10.90 | 4.22 | 8.90 | 10.80 |
| 8 | 6.68 | 7.75 | 4.91 | 5.61 | 9.90 | 8.87 | 7.92 | 0.00 | 8.07 | 9.87 | 7.43 | 13.50 |
| 9 | 4.01 | 6.57 | 7.39 | 7.16 | 13.90 | 5.56 | 10.90 | 8.07 | 0.00 | 13.50 | 4.72 | 17.60 |
| 10 | 12.30 | 13.70 | 11.20 | 11.90 | 6.13 | 13.30 | 4.22 | 9.87 | 13.50 | 0.00 | 11.40 | 9.44 |
| 11 | 4.56 | 7.50 | 6.97 | 7.85 | 12.20 | 6.42 | 8.90 | 7.43 | 4.72 | 11.40 | 0.00 | 15.30 |
| 12 | 16.50 | 17.20 | 14.10 | 15.30 | 8.33 | 18.00 | 10.80 | 13.50 | 17.60 | 9.44 | 15.30 | 0.00 |
The table contains RMSD values (calculated on the Cα atoms) between the predicted models.
Read more about the root-mean-square deviation (RMSD) measure.
| # | 1 | 2 | 3 | 4 | 5 | 6 | 7 | 8 | 9 | 10 | 11 | 12 |
| 1 | 1.00 | 0.60 | 0.48 | 0.50 | 0.44 | 0.58 | 0.43 | 0.44 | 0.60 | 0.40 | 0.63 | 0.42 |
| 2 | 0.60 | 1.00 | 0.53 | 0.51 | 0.43 | 0.52 | 0.43 | 0.43 | 0.58 | 0.41 | 0.59 | 0.44 |
| 3 | 0.48 | 0.53 | 1.00 | 0.59 | 0.48 | 0.45 | 0.50 | 0.55 | 0.47 | 0.47 | 0.54 | 0.49 |
| 4 | 0.50 | 0.51 | 0.59 | 1.00 | 0.46 | 0.44 | 0.51 | 0.55 | 0.50 | 0.51 | 0.49 | 0.42 |
| 5 | 0.44 | 0.43 | 0.48 | 0.46 | 1.00 | 0.39 | 0.51 | 0.51 | 0.43 | 0.51 | 0.48 | 0.46 |
| 6 | 0.58 | 0.52 | 0.45 | 0.44 | 0.39 | 1.00 | 0.43 | 0.39 | 0.54 | 0.39 | 0.56 | 0.41 |
| 7 | 0.43 | 0.43 | 0.50 | 0.51 | 0.51 | 0.43 | 1.00 | 0.55 | 0.44 | 0.64 | 0.45 | 0.39 |
| 8 | 0.44 | 0.43 | 0.55 | 0.55 | 0.51 | 0.39 | 0.55 | 1.00 | 0.43 | 0.56 | 0.46 | 0.40 |
| 9 | 0.60 | 0.58 | 0.47 | 0.50 | 0.43 | 0.54 | 0.44 | 0.43 | 1.00 | 0.43 | 0.60 | 0.39 |
| 10 | 0.40 | 0.41 | 0.47 | 0.51 | 0.51 | 0.39 | 0.64 | 0.56 | 0.43 | 1.00 | 0.46 | 0.37 |
| 11 | 0.63 | 0.59 | 0.54 | 0.49 | 0.48 | 0.56 | 0.45 | 0.46 | 0.60 | 0.46 | 1.00 | 0.47 |
| 12 | 0.42 | 0.44 | 0.49 | 0.42 | 0.46 | 0.41 | 0.39 | 0.40 | 0.39 | 0.37 | 0.47 | 1.00 |
The table contains GDT_TS values (calculated on the Cα atoms) between the predicted models.
Read more about the global distance test (GDT, also written as GDT_TS to represent "total score") measure.
© Laboratory of Theory of Biopolymers, Faculty of Chemistry, University of Warsaw 2013