Status: Done started: 2018-Apr-28 09:05:51 UTC
| Project Name | Bh_Alp |
| Sequence | SEEKKEYLIV VEPEEVSAQS VEESYDVDVI HEFEEIPVIH AELTKKELKK LKKDPNVKAI EKNAEVTISQ TVPWGISFIN TQQAHNRGIF GNGARVAVLD TGIASHPDLR IAGGASFISS EPSYHDNNGH GTHVAGTIAA LNNSIGVLGV APSADLYAVK VLDRNGSGSL ASVAQGIEWA INNNMHIINM SLGSTSGSST LELAVNRANN AGILLVGAAG NTGRQGVNYP ARYSGVMAVA AVDQNGQRAS FSTYGPEIEI SAPGVNVNST YTGNRYVSLS GTSMATPHVA GVAALVKSRY PSYTNNQIRQ RINQTATYLG SPSLYGNGLV HAGRATQ |
| Secondary structure | CCCEEEEEEE ECCCCCCHHH HHHHCCCEEE EEECCCCEEE EEEEHHHHHC CCCCCCEEEE EECCEEEECC CCCCCCCCCC HHHHHHCCCC CCCCEEEEEE CCCCCCCCCC CCEEEECCCC CCCCCCCCCH HHHHHHHHHC CCCCCCCCCC CCCCEEEEEE CCCCCCEEEH HHHHHHHHHH HHCCCCEEEE CEECCCCCHH HHHHHHHHHH CCCEEEEECC CCCCCCCCCC CCCCCCEEEE CCCCCCCCCC CCCCCCCCCE ECCCCCEEEE ECCCEEEEEC CHHHHHHHHH HHHHHHHHHC CCCCHHHHHH HHHHHCCCCC CCCCCCEEEC CHHHHHC |
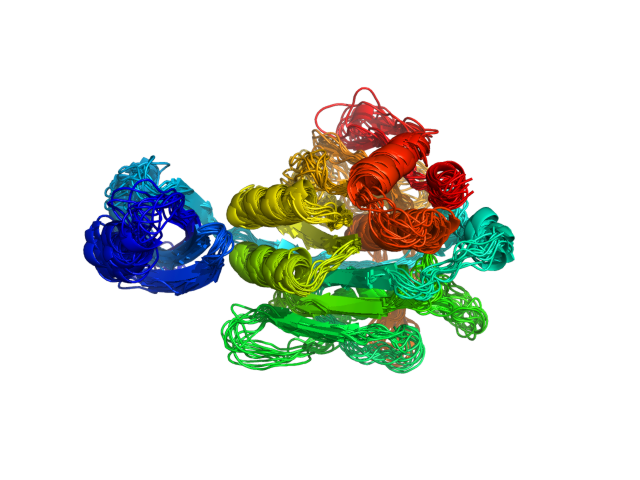
| Movie from predicted structures | To download the movie, right click on the desired file format:  
|
| Estimated finish time | 2018-Apr-28 14:09 UTC |
| Project Name | Bh_Alp |


| Project Name | Bh_Alp |
| Cluster # | 1 | 2 | 3 | 4 | 5 | 6 | 7 | 8 | 9 | 10 | 11 | 12 |
| Cluster density | 241.2 | 158.9 | 158.7 | 144.1 | 138.5 | 132.8 | 131.3 | 112.2 | 107.5 | 91.0 | 88.1 | 80.9 |
| Cluster size | 310 | 199 | 192 | 182 | 178 | 169 | 162 | 135 | 137 | 126 | 115 | 95 |
| Average cluster RMSD | 1.3 | 1.3 | 1.2 | 1.3 | 1.3 | 1.3 | 1.2 | 1.2 | 1.3 | 1.4 | 1.3 | 1.2 |
| # | 1 | 2 | 3 | 4 | 5 | 6 | 7 | 8 | 9 | 10 | 11 | 12 |
| RMSD | 2.38 | 2.45 | 2.46 | 2.56 | 2.29 | 2.54 | 2.58 | 2.55 | 2.80 | 2.44 | 2.85 | 2.83 |
| GDT_TS | 0.71 | 0.68 | 0.68 | 0.69 | 0.70 | 0.68 | 0.68 | 0.67 | 0.65 | 0.71 | 0.67 | 0.66 |
The table contains RMSD and GDT_TS values (calculated on the Cα atoms) between the predicted models and the input structure. Note that GDT_TS metric is intended as a more accurate measurement than the more common RMSD.
Read more about the root-mean-square deviation (RMSD) measure
Read more about the global distance test (GDT, also written as GDT_TS to represent "total score") measure.
| # | 1 | 2 | 3 | 4 | 5 | 6 | 7 | 8 | 9 | 10 | 11 | 12 |
| 1 | 0.00 | 2.01 | 1.98 | 2.19 | 2.12 | 2.06 | 2.16 | 1.94 | 2.31 | 2.01 | 2.63 | 2.41 |
| 2 | 2.01 | 0.00 | 2.18 | 2.32 | 2.06 | 2.16 | 2.28 | 2.06 | 2.27 | 1.94 | 2.51 | 2.39 |
| 3 | 1.98 | 2.18 | 0.00 | 1.94 | 1.99 | 2.06 | 1.88 | 2.04 | 2.06 | 1.97 | 2.20 | 2.21 |
| 4 | 2.19 | 2.32 | 1.94 | 0.00 | 2.13 | 2.49 | 2.11 | 2.25 | 2.05 | 2.16 | 2.15 | 2.43 |
| 5 | 2.12 | 2.06 | 1.99 | 2.13 | 0.00 | 2.31 | 2.01 | 2.19 | 2.24 | 2.12 | 2.45 | 2.27 |
| 6 | 2.06 | 2.16 | 2.06 | 2.49 | 2.31 | 0.00 | 2.24 | 2.08 | 2.48 | 2.04 | 2.70 | 2.41 |
| 7 | 2.16 | 2.28 | 1.88 | 2.11 | 2.01 | 2.24 | 0.00 | 2.22 | 2.10 | 2.26 | 2.45 | 2.22 |
| 8 | 1.94 | 2.06 | 2.04 | 2.25 | 2.19 | 2.08 | 2.22 | 0.00 | 2.44 | 2.02 | 2.48 | 2.32 |
| 9 | 2.31 | 2.27 | 2.06 | 2.05 | 2.24 | 2.48 | 2.10 | 2.44 | 0.00 | 2.30 | 2.31 | 2.41 |
| 10 | 2.01 | 1.94 | 1.97 | 2.16 | 2.12 | 2.04 | 2.26 | 2.02 | 2.30 | 0.00 | 2.46 | 2.29 |
| 11 | 2.63 | 2.51 | 2.20 | 2.15 | 2.45 | 2.70 | 2.45 | 2.48 | 2.31 | 2.46 | 0.00 | 2.49 |
| 12 | 2.41 | 2.39 | 2.21 | 2.43 | 2.27 | 2.41 | 2.22 | 2.32 | 2.41 | 2.29 | 2.49 | 0.00 |
The table contains RMSD values (calculated on the Cα atoms) between the predicted models.
Read more about the root-mean-square deviation (RMSD) measure.
| # | 1 | 2 | 3 | 4 | 5 | 6 | 7 | 8 | 9 | 10 | 11 | 12 |
| 1 | 1.00 | 0.75 | 0.74 | 0.70 | 0.73 | 0.73 | 0.73 | 0.75 | 0.73 | 0.76 | 0.69 | 0.72 |
| 2 | 0.75 | 1.00 | 0.71 | 0.69 | 0.73 | 0.73 | 0.71 | 0.74 | 0.73 | 0.78 | 0.69 | 0.71 |
| 3 | 0.74 | 0.71 | 1.00 | 0.75 | 0.74 | 0.75 | 0.75 | 0.75 | 0.74 | 0.75 | 0.72 | 0.72 |
| 4 | 0.70 | 0.69 | 0.75 | 1.00 | 0.71 | 0.70 | 0.72 | 0.72 | 0.73 | 0.75 | 0.75 | 0.71 |
| 5 | 0.73 | 0.73 | 0.74 | 0.71 | 1.00 | 0.71 | 0.75 | 0.70 | 0.71 | 0.74 | 0.70 | 0.72 |
| 6 | 0.73 | 0.73 | 0.75 | 0.70 | 0.71 | 1.00 | 0.72 | 0.75 | 0.72 | 0.75 | 0.67 | 0.72 |
| 7 | 0.73 | 0.71 | 0.75 | 0.72 | 0.75 | 0.72 | 1.00 | 0.73 | 0.73 | 0.73 | 0.71 | 0.74 |
| 8 | 0.75 | 0.74 | 0.75 | 0.72 | 0.70 | 0.75 | 0.73 | 1.00 | 0.71 | 0.75 | 0.69 | 0.72 |
| 9 | 0.73 | 0.73 | 0.74 | 0.73 | 0.71 | 0.72 | 0.73 | 0.71 | 1.00 | 0.73 | 0.73 | 0.72 |
| 10 | 0.76 | 0.78 | 0.75 | 0.75 | 0.74 | 0.75 | 0.73 | 0.75 | 0.73 | 1.00 | 0.72 | 0.71 |
| 11 | 0.69 | 0.69 | 0.72 | 0.75 | 0.70 | 0.67 | 0.71 | 0.69 | 0.73 | 0.72 | 1.00 | 0.70 |
| 12 | 0.72 | 0.71 | 0.72 | 0.71 | 0.72 | 0.72 | 0.74 | 0.72 | 0.72 | 0.71 | 0.70 | 1.00 |
The table contains GDT_TS values (calculated on the Cα atoms) between the predicted models.
Read more about the global distance test (GDT, also written as GDT_TS to represent "total score") measure.
© Laboratory of Theory of Biopolymers, Faculty of Chemistry, University of Warsaw 2013