Status: Done started: 2018-Oct-09 06:14:35 UTC
| Project Name | |
| Sequence | VLSPADKTNV KAAWGKVGAH AGEYGAEALE RMFLSFPTTK TYFPHFDLSH GSAQVKGHGK KVADALTNAV AHVDDMPNAL SALSDLHAHK LRVDPVNFKL LSHCLLVTLA AHLPAEFTPA VHASLDKFLA SVSTVLTSKY R |
| Secondary structure | CCCHHHHHHH HHHHHHHCCC HHHHHHHHHH HHHHHCCCCC CCCCCCCCCC CCHHHHHHHH HHHHHHHHHH HCCCCHHHHH HHHHHHHHCC CCCCCHHHHH HHHHHHHHHH HHCCCCCCHH HHHHHHHHHH HHHHHHCCCC C |
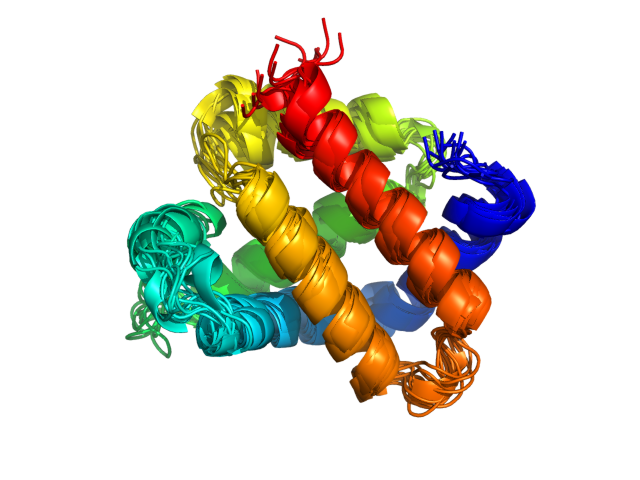
| Movie from predicted structures | To download the movie, right click on the desired file format:  
|
| Estimated finish time | 2018-Oct-09 10:52 UTC |
| Project Name |


| Project Name |
| Cluster # | 1 | 2 | 3 | 4 | 5 | 6 | 7 | 8 | 9 | 10 | 11 | 12 |
| Cluster density | 290.0 | 199.7 | 167.8 | 155.6 | 133.4 | 129.6 | 113.1 | 94.2 | 88.4 | 84.4 | 81.6 | 70.4 |
| Cluster size | 380 | 235 | 225 | 159 | 176 | 148 | 140 | 126 | 129 | 104 | 102 | 76 |
| Average cluster RMSD | 1.3 | 1.2 | 1.3 | 1.0 | 1.3 | 1.1 | 1.2 | 1.3 | 1.5 | 1.2 | 1.2 | 1.1 |
| # | 1 | 2 | 3 | 4 | 5 | 6 | 7 | 8 | 9 | 10 | 11 | 12 |
| RMSD | 2.72 | 2.77 | 2.42 | 3.06 | 2.71 | 2.51 | 2.50 | 2.33 | 2.13 | 2.47 | 2.79 | 2.66 |
| GDT_TS | 0.73 | 0.70 | 0.76 | 0.69 | 0.75 | 0.72 | 0.75 | 0.78 | 0.76 | 0.75 | 0.74 | 0.74 |
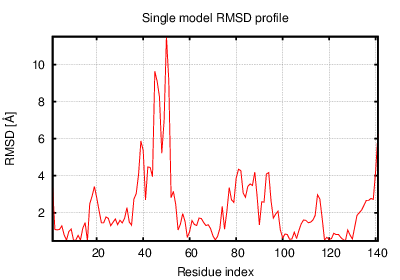
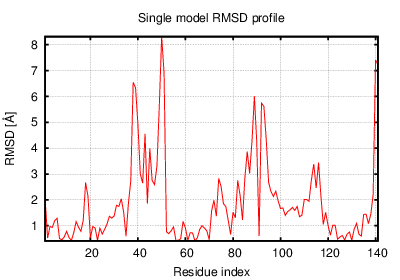
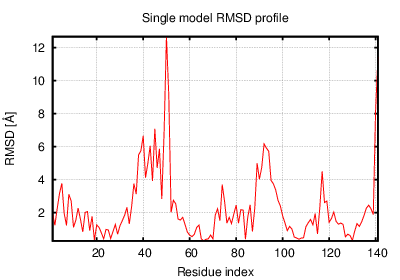
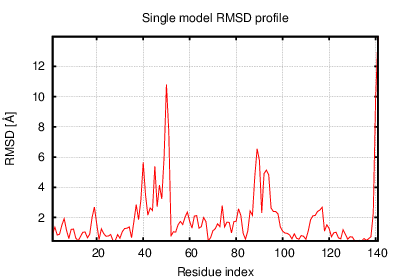
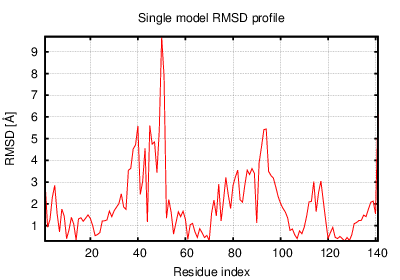
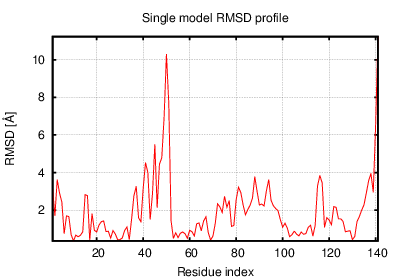
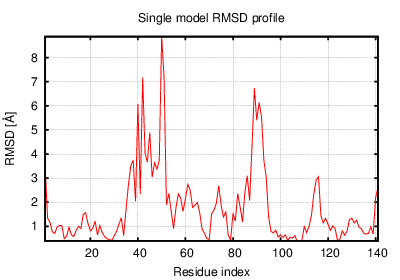
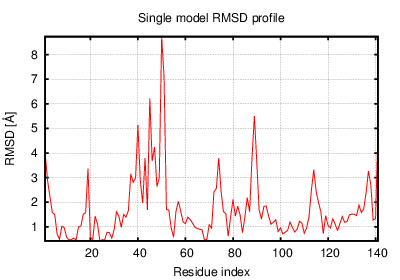
The table contains RMSD and GDT_TS values (calculated on the Cα atoms) between the predicted models and the input structure. Note that GDT_TS metric is intended as a more accurate measurement than the more common RMSD.
Read more about the root-mean-square deviation (RMSD) measure
Read more about the global distance test (GDT, also written as GDT_TS to represent "total score") measure.
| # | 1 | 2 | 3 | 4 | 5 | 6 | 7 | 8 | 9 | 10 | 11 | 12 |
| 1 | 0.00 | 1.85 | 2.48 | 2.26 | 2.65 | 1.94 | 2.74 | 2.87 | 2.41 | 2.10 | 2.88 | 1.64 |
| 2 | 1.85 | 0.00 | 2.60 | 2.34 | 2.67 | 1.76 | 2.45 | 2.76 | 2.05 | 2.30 | 3.00 | 2.06 |
| 3 | 2.48 | 2.60 | 0.00 | 2.05 | 1.85 | 2.20 | 2.32 | 1.88 | 1.68 | 1.72 | 1.74 | 2.04 |
| 4 | 2.26 | 2.34 | 2.05 | 0.00 | 2.05 | 1.89 | 2.27 | 2.56 | 2.25 | 2.24 | 2.28 | 1.98 |
| 5 | 2.65 | 2.67 | 1.85 | 2.05 | 0.00 | 2.36 | 1.96 | 2.47 | 2.03 | 2.11 | 1.73 | 2.04 |
| 6 | 1.94 | 1.76 | 2.20 | 1.89 | 2.36 | 0.00 | 2.12 | 2.45 | 1.99 | 1.83 | 2.67 | 1.98 |
| 7 | 2.74 | 2.45 | 2.32 | 2.27 | 1.96 | 2.12 | 0.00 | 2.67 | 2.11 | 2.50 | 2.43 | 2.32 |
| 8 | 2.87 | 2.76 | 1.88 | 2.56 | 2.47 | 2.45 | 2.67 | 0.00 | 1.98 | 2.18 | 2.13 | 2.56 |
| 9 | 2.41 | 2.05 | 1.68 | 2.25 | 2.03 | 1.99 | 2.11 | 1.98 | 0.00 | 2.03 | 2.16 | 2.08 |
| 10 | 2.10 | 2.30 | 1.72 | 2.24 | 2.11 | 1.83 | 2.50 | 2.18 | 2.03 | 0.00 | 2.25 | 1.94 |
| 11 | 2.88 | 3.00 | 1.74 | 2.28 | 1.73 | 2.67 | 2.43 | 2.13 | 2.16 | 2.25 | 0.00 | 2.29 |
| 12 | 1.64 | 2.06 | 2.04 | 1.98 | 2.04 | 1.98 | 2.32 | 2.56 | 2.08 | 1.94 | 2.29 | 0.00 |
The table contains RMSD values (calculated on the Cα atoms) between the predicted models.
Read more about the root-mean-square deviation (RMSD) measure.
| # | 1 | 2 | 3 | 4 | 5 | 6 | 7 | 8 | 9 | 10 | 11 | 12 |
| 1 | 1.00 | 0.76 | 0.75 | 0.78 | 0.76 | 0.80 | 0.75 | 0.72 | 0.70 | 0.77 | 0.73 | 0.85 |
| 2 | 0.76 | 1.00 | 0.72 | 0.79 | 0.70 | 0.83 | 0.78 | 0.75 | 0.79 | 0.73 | 0.68 | 0.74 |
| 3 | 0.75 | 0.72 | 1.00 | 0.76 | 0.83 | 0.77 | 0.74 | 0.83 | 0.82 | 0.82 | 0.84 | 0.79 |
| 4 | 0.78 | 0.79 | 0.76 | 1.00 | 0.75 | 0.87 | 0.78 | 0.75 | 0.76 | 0.76 | 0.72 | 0.77 |
| 5 | 0.76 | 0.70 | 0.83 | 0.75 | 1.00 | 0.77 | 0.76 | 0.77 | 0.78 | 0.81 | 0.83 | 0.79 |
| 6 | 0.80 | 0.83 | 0.77 | 0.87 | 0.77 | 1.00 | 0.79 | 0.74 | 0.76 | 0.78 | 0.72 | 0.79 |
| 7 | 0.75 | 0.78 | 0.74 | 0.78 | 0.76 | 0.79 | 1.00 | 0.73 | 0.76 | 0.72 | 0.70 | 0.73 |
| 8 | 0.72 | 0.75 | 0.83 | 0.75 | 0.77 | 0.74 | 0.73 | 1.00 | 0.81 | 0.75 | 0.78 | 0.76 |
| 9 | 0.70 | 0.79 | 0.82 | 0.76 | 0.78 | 0.76 | 0.76 | 0.81 | 1.00 | 0.77 | 0.77 | 0.76 |
| 10 | 0.77 | 0.73 | 0.82 | 0.76 | 0.81 | 0.78 | 0.72 | 0.75 | 0.77 | 1.00 | 0.76 | 0.79 |
| 11 | 0.73 | 0.68 | 0.84 | 0.72 | 0.83 | 0.72 | 0.70 | 0.78 | 0.77 | 0.76 | 1.00 | 0.76 |
| 12 | 0.85 | 0.74 | 0.79 | 0.77 | 0.79 | 0.79 | 0.73 | 0.76 | 0.76 | 0.79 | 0.76 | 1.00 |
The table contains GDT_TS values (calculated on the Cα atoms) between the predicted models.
Read more about the global distance test (GDT, also written as GDT_TS to represent "total score") measure.
© Laboratory of Theory of Biopolymers, Faculty of Chemistry, University of Warsaw 2013