Status: Done started: 2018-Oct-03 06:56:36 UTC
| Project Name | |
| Sequence | NAMADQLTEE QIAEFKEAFS LFDKDGDGTI TTKELGTVMR SLGQNPTEAE LQDMINEVDA DGNGTIDFPE FLTMMARKMK DTDSEEEIRE AFRVFDKDGN GYISAAELRH VMTNLGEKLT DEEVDEMIRE ADIDGDGQVN YEEFVQMMTA K |
| Secondary structure | CCCCCCCCHH HHHHHHHHHH HHCCCCCCEE CHHHHHHHHH HCCCCCCHHH HHHHHHHHCC CCCCCEEHHH HHHHHHHHHH HHHHHHHHHH HHHHHCCCCC CEECHHHHHH HHHHCCCCCC HHHHHHHHHH HCCCCCCCEE HHHHHHHHCC C |
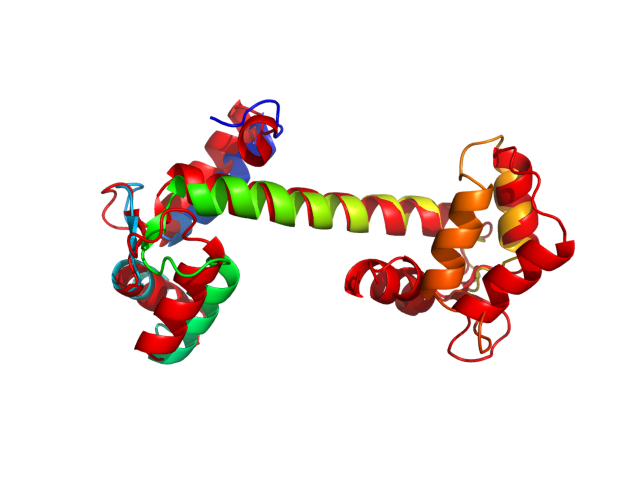
| Movie from predicted structures | To download the movie, right click on the desired file format:  
|
| Estimated finish time | 2018-Oct-03 11:35 UTC |
| Project Name |
| Project Name |
| Cluster # | 1 | 2 | 3 | 4 | 5 | 6 | 7 | 8 | 9 | 10 | 11 | 12 |
| Cluster density | 251.1 | 198.3 | 174.0 | 143.2 | 137.7 | 117.7 | 110.7 | 102.1 | 84.5 | 74.1 | 54.8 | 49.5 |
| Cluster size | 355 | 266 | 223 | 204 | 182 | 151 | 154 | 141 | 104 | 95 | 65 | 60 |
| Average cluster RMSD | 1.4 | 1.3 | 1.3 | 1.4 | 1.3 | 1.3 | 1.4 | 1.4 | 1.2 | 1.3 | 1.2 | 1.2 |
| # | 1 | 2 | 3 | 4 | 5 | 6 | 7 | 8 | 9 | 10 | 11 | 12 |
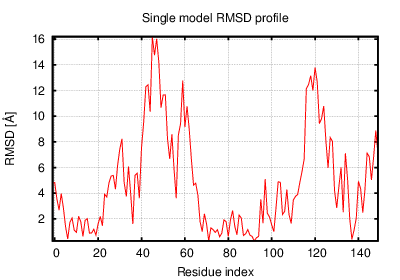
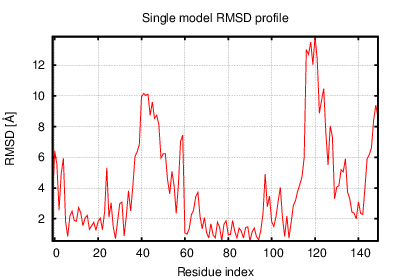
| RMSD | 6.98 | 6.79 | 5.22 | 6.84 | 5.96 | 5.22 | 6.71 | 5.99 | 5.61 | 4.85 | 4.61 | 4.79 |
| GDT_TS | 0.42 | 0.41 | 0.51 | 0.41 | 0.45 | 0.51 | 0.43 | 0.47 | 0.49 | 0.53 | 0.53 | 0.54 |
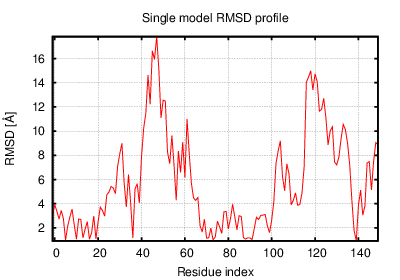
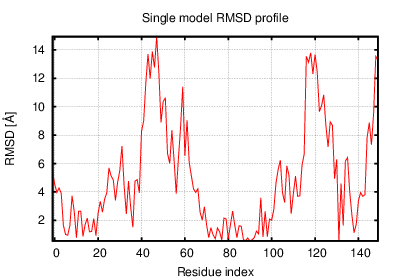
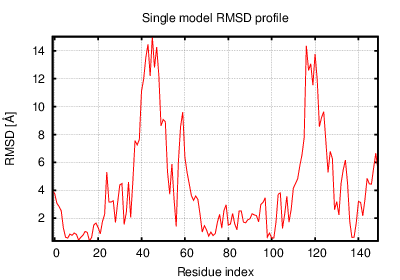
The table contains RMSD and GDT_TS values (calculated on the Cα atoms) between the predicted models and the input structure. Note that GDT_TS metric is intended as a more accurate measurement than the more common RMSD.
Read more about the root-mean-square deviation (RMSD) measure
Read more about the global distance test (GDT, also written as GDT_TS to represent "total score") measure.
| # | 1 | 2 | 3 | 4 | 5 | 6 | 7 | 8 | 9 | 10 | 11 | 12 |
| 1 | 0.00 | 1.86 | 2.96 | 2.04 | 2.15 | 3.41 | 2.07 | 2.13 | 3.31 | 4.28 | 5.15 | 5.45 |
| 2 | 1.86 | 0.00 | 3.14 | 1.47 | 2.30 | 3.59 | 2.34 | 2.48 | 3.56 | 4.24 | 5.04 | 5.35 |
| 3 | 2.96 | 3.14 | 0.00 | 3.25 | 2.21 | 1.85 | 2.94 | 2.05 | 2.03 | 2.65 | 3.22 | 3.87 |
| 4 | 2.04 | 1.47 | 3.25 | 0.00 | 2.51 | 3.78 | 2.62 | 2.52 | 3.65 | 4.40 | 5.19 | 5.50 |
| 5 | 2.15 | 2.30 | 2.21 | 2.51 | 0.00 | 2.75 | 2.16 | 1.81 | 2.92 | 3.28 | 4.06 | 4.47 |
| 6 | 3.41 | 3.59 | 1.85 | 3.78 | 2.75 | 0.00 | 2.89 | 2.45 | 2.65 | 2.07 | 2.84 | 3.35 |
| 7 | 2.07 | 2.34 | 2.94 | 2.62 | 2.16 | 2.89 | 0.00 | 2.20 | 3.52 | 3.77 | 4.59 | 4.90 |
| 8 | 2.13 | 2.48 | 2.05 | 2.52 | 1.81 | 2.45 | 2.20 | 0.00 | 2.32 | 3.25 | 3.97 | 4.41 |
| 9 | 3.31 | 3.56 | 2.03 | 3.65 | 2.92 | 2.65 | 3.52 | 2.32 | 0.00 | 3.17 | 3.70 | 4.58 |
| 10 | 4.28 | 4.24 | 2.65 | 4.40 | 3.28 | 2.07 | 3.77 | 3.25 | 3.17 | 0.00 | 2.16 | 2.87 |
| 11 | 5.15 | 5.04 | 3.22 | 5.19 | 4.06 | 2.84 | 4.59 | 3.97 | 3.70 | 2.16 | 0.00 | 2.08 |
| 12 | 5.45 | 5.35 | 3.87 | 5.50 | 4.47 | 3.35 | 4.90 | 4.41 | 4.58 | 2.87 | 2.08 | 0.00 |
The table contains RMSD values (calculated on the Cα atoms) between the predicted models.
Read more about the root-mean-square deviation (RMSD) measure.
| # | 1 | 2 | 3 | 4 | 5 | 6 | 7 | 8 | 9 | 10 | 11 | 12 |
| 1 | 1.00 | 0.77 | 0.67 | 0.80 | 0.73 | 0.63 | 0.75 | 0.73 | 0.63 | 0.54 | 0.51 | 0.49 |
| 2 | 0.77 | 1.00 | 0.64 | 0.85 | 0.74 | 0.62 | 0.73 | 0.68 | 0.59 | 0.52 | 0.49 | 0.50 |
| 3 | 0.67 | 0.64 | 1.00 | 0.66 | 0.73 | 0.81 | 0.66 | 0.75 | 0.77 | 0.66 | 0.64 | 0.61 |
| 4 | 0.80 | 0.85 | 0.66 | 1.00 | 0.76 | 0.60 | 0.73 | 0.71 | 0.60 | 0.50 | 0.47 | 0.48 |
| 5 | 0.73 | 0.74 | 0.73 | 0.76 | 1.00 | 0.69 | 0.76 | 0.77 | 0.65 | 0.59 | 0.56 | 0.51 |
| 6 | 0.63 | 0.62 | 0.81 | 0.60 | 0.69 | 1.00 | 0.68 | 0.71 | 0.72 | 0.75 | 0.67 | 0.65 |
| 7 | 0.75 | 0.73 | 0.66 | 0.73 | 0.76 | 0.68 | 1.00 | 0.74 | 0.60 | 0.57 | 0.53 | 0.51 |
| 8 | 0.73 | 0.68 | 0.75 | 0.71 | 0.77 | 0.71 | 0.74 | 1.00 | 0.71 | 0.64 | 0.58 | 0.57 |
| 9 | 0.63 | 0.59 | 0.77 | 0.60 | 0.65 | 0.72 | 0.60 | 0.71 | 1.00 | 0.66 | 0.62 | 0.58 |
| 10 | 0.54 | 0.52 | 0.66 | 0.50 | 0.59 | 0.75 | 0.57 | 0.64 | 0.66 | 1.00 | 0.75 | 0.69 |
| 11 | 0.51 | 0.49 | 0.64 | 0.47 | 0.56 | 0.67 | 0.53 | 0.58 | 0.62 | 0.75 | 1.00 | 0.77 |
| 12 | 0.49 | 0.50 | 0.61 | 0.48 | 0.51 | 0.65 | 0.51 | 0.57 | 0.58 | 0.69 | 0.77 | 1.00 |
The table contains GDT_TS values (calculated on the Cα atoms) between the predicted models.
Read more about the global distance test (GDT, also written as GDT_TS to represent "total score") measure.
© Laboratory of Theory of Biopolymers, Faculty of Chemistry, University of Warsaw 2013