Status: Done started: 2018-May-01 14:35:41 UTC
| Project Name | 1zah |
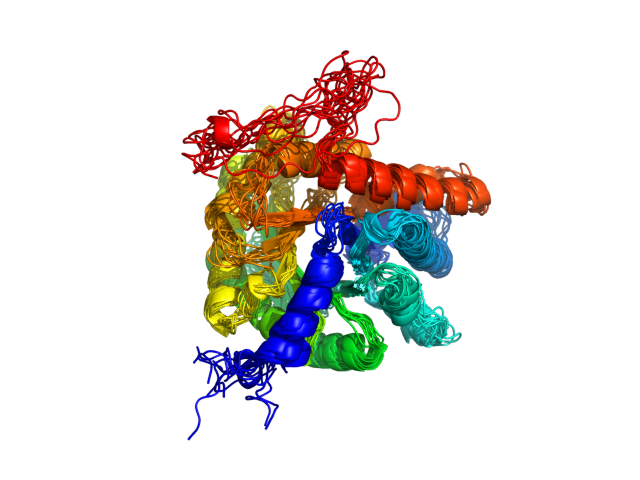
| Sequence | PHSHPALTPE QKKELSDIAH RIVAPGKGIL AADESTGSIA KRLQSIGTEN TEENRRFYRQ LLLTADDRVN PCIGGVILFH ETLYQKADDG RPFPQVIKSK GGVVGIKVDK GVVPLAGTNG ETTTQGLDGL SERCAQYKKD GADFAKWRCV LKIGEHTPSA LAIMENANVL ARYASICQQN GIVPIVEPEI LPDGDHDLKR CQYVTEKVLA AVYKALSDHH IYLEGTLLKP NMVTPGHACT QKYSHEEIAM ATVTALRRTV PPAVTGVTFL SGGQSEEEAS INLNAINKCP LLKPWALTFS YGRALQASAL KAWGGKKENL KAAQEEYVKR ALANSLACQG KYTPSGQAGA AASESLFISN HAY |
| Secondary structure | CCCCCCCCHH HHHHHHHHHH HHCCCCCEEE EECCCHHHHH HHHHCCCCCC CHHHHHHHHH HHHCCCCCCC CCEEEEEECH HHHCCCCCCC CCHHHHHHHC CCEEEEECCC CEEECCCCCC CEEECCCCCH HHHHHHHHHC CCCEEEEEEE ECCCCCCCCH HHHHHHHHHH HHHHHHHHHC CCEEEEEEEE CCCCCCCHHH HHHHHHHHHH HHHHHHHHCC CCCCCCEECC CCCCCCCCCC CCCCHHHHHH HHHHHHHCCC CCCCCEEEEC CCCCCHHHHH HHHHHHHHCC CCCCCEEEEE ECHHHHHHHH HHHCCCCCCH HHHHHHHHHH HHHHHHHCCC CCCCCCCCCC CCCCCCCCCC CCC |
| Movie from predicted structures | To download the movie, right click on the desired file format:  
|
| Estimated finish time | 2018-May-01 19:42 UTC |
| Project Name | 1zah |


| Project Name | 1zah |
| Cluster # | 1 | 2 | 3 | 4 | 5 | 6 | 7 | 8 | 9 | 10 | 11 | 12 |
| Cluster density | 140.6 | 133.0 | 115.6 | 114.3 | 96.5 | 87.5 | 85.8 | 81.1 | 73.1 | 71.6 | 66.3 | 43.4 |
| Cluster size | 243 | 237 | 213 | 206 | 184 | 165 | 163 | 151 | 129 | 125 | 116 | 68 |
| Average cluster RMSD | 1.7 | 1.8 | 1.8 | 1.8 | 1.9 | 1.9 | 1.9 | 1.9 | 1.8 | 1.7 | 1.7 | 1.6 |
| # | 1 | 2 | 3 | 4 | 5 | 6 | 7 | 8 | 9 | 10 | 11 | 12 |
| RMSD | 2.95 | 3.11 | 3.04 | 3.12 | 3.07 | 3.34 | 3.59 | 3.26 | 3.25 | 3.78 | 3.07 | 3.54 |
| GDT_TS | 0.69 | 0.66 | 0.69 | 0.66 | 0.67 | 0.63 | 0.66 | 0.67 | 0.67 | 0.63 | 0.66 | 0.65 |
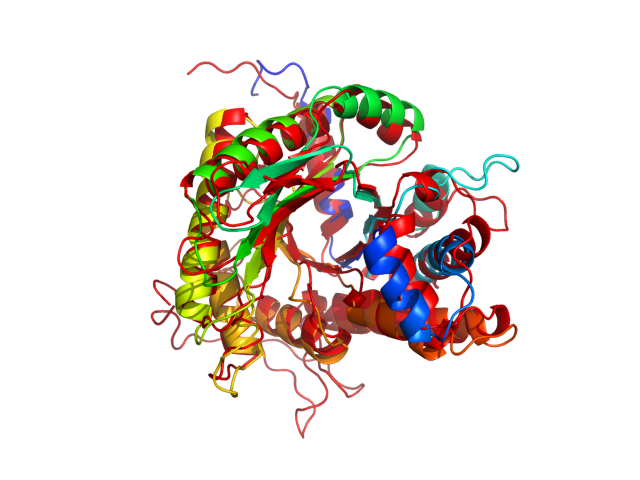
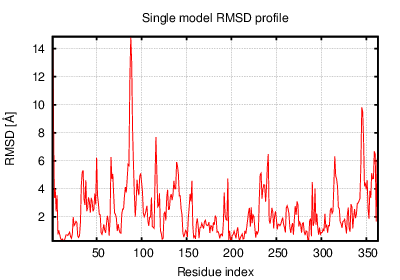
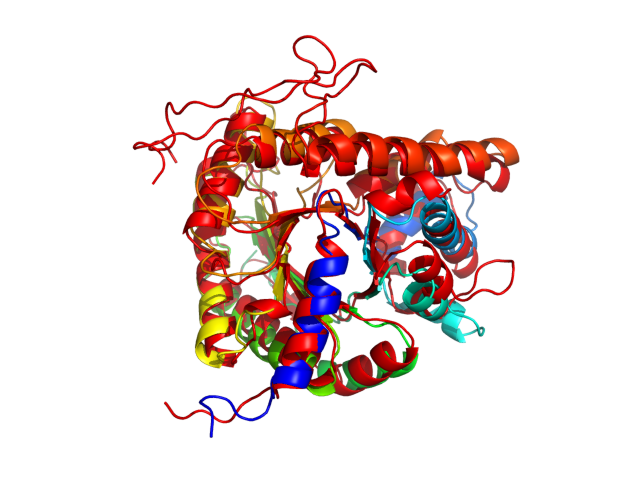
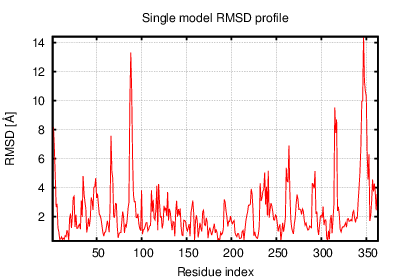
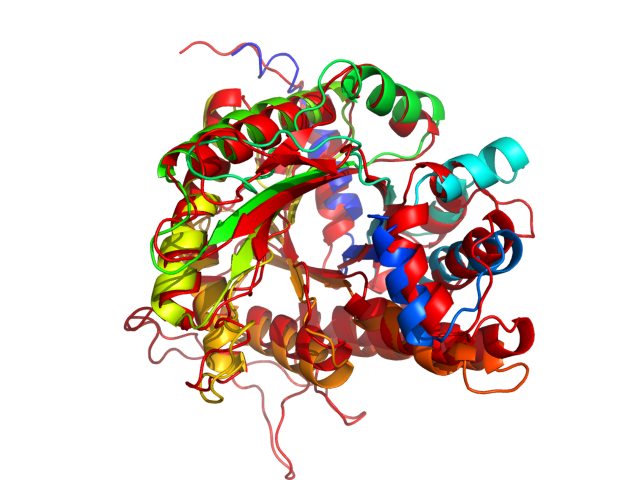
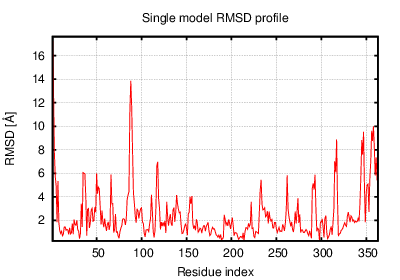
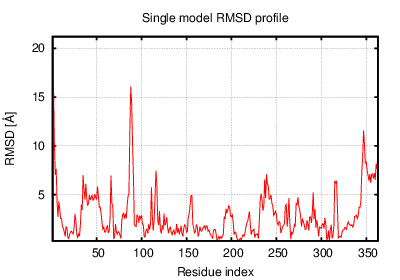
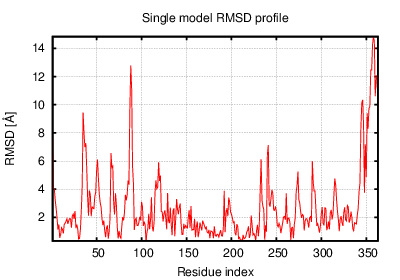
The table contains RMSD and GDT_TS values (calculated on the Cα atoms) between the predicted models and the input structure. Note that GDT_TS metric is intended as a more accurate measurement than the more common RMSD.
Read more about the root-mean-square deviation (RMSD) measure
Read more about the global distance test (GDT, also written as GDT_TS to represent "total score") measure.
| # | 1 | 2 | 3 | 4 | 5 | 6 | 7 | 8 | 9 | 10 | 11 | 12 |
| 1 | 0.00 | 2.39 | 2.29 | 2.55 | 2.19 | 2.53 | 3.02 | 2.78 | 2.64 | 3.09 | 2.58 | 3.04 |
| 2 | 2.39 | 0.00 | 2.46 | 2.14 | 2.38 | 2.46 | 2.55 | 2.29 | 2.52 | 2.67 | 2.03 | 2.97 |
| 3 | 2.29 | 2.46 | 0.00 | 2.51 | 2.38 | 2.80 | 2.83 | 2.79 | 2.68 | 3.10 | 2.46 | 3.38 |
| 4 | 2.55 | 2.14 | 2.51 | 0.00 | 2.70 | 2.51 | 2.56 | 2.35 | 2.70 | 3.07 | 2.20 | 3.04 |
| 5 | 2.19 | 2.38 | 2.38 | 2.70 | 0.00 | 2.39 | 2.88 | 2.82 | 2.34 | 2.89 | 2.42 | 3.45 |
| 6 | 2.53 | 2.46 | 2.80 | 2.51 | 2.39 | 0.00 | 2.81 | 2.71 | 2.76 | 2.97 | 2.62 | 3.14 |
| 7 | 3.02 | 2.55 | 2.83 | 2.56 | 2.88 | 2.81 | 0.00 | 2.12 | 2.76 | 2.61 | 2.50 | 3.31 |
| 8 | 2.78 | 2.29 | 2.79 | 2.35 | 2.82 | 2.71 | 2.12 | 0.00 | 2.79 | 2.63 | 2.45 | 2.80 |
| 9 | 2.64 | 2.52 | 2.68 | 2.70 | 2.34 | 2.76 | 2.76 | 2.79 | 0.00 | 2.49 | 2.35 | 3.15 |
| 10 | 3.09 | 2.67 | 3.10 | 3.07 | 2.89 | 2.97 | 2.61 | 2.63 | 2.49 | 0.00 | 2.74 | 3.32 |
| 11 | 2.58 | 2.03 | 2.46 | 2.20 | 2.42 | 2.62 | 2.50 | 2.45 | 2.35 | 2.74 | 0.00 | 2.94 |
| 12 | 3.04 | 2.97 | 3.38 | 3.04 | 3.45 | 3.14 | 3.31 | 2.80 | 3.15 | 3.32 | 2.94 | 0.00 |
The table contains RMSD values (calculated on the Cα atoms) between the predicted models.
Read more about the root-mean-square deviation (RMSD) measure.
| # | 1 | 2 | 3 | 4 | 5 | 6 | 7 | 8 | 9 | 10 | 11 | 12 |
| 1 | 1.00 | 0.71 | 0.75 | 0.72 | 0.74 | 0.71 | 0.70 | 0.71 | 0.75 | 0.72 | 0.71 | 0.69 |
| 2 | 0.71 | 1.00 | 0.74 | 0.78 | 0.71 | 0.71 | 0.74 | 0.78 | 0.73 | 0.71 | 0.78 | 0.71 |
| 3 | 0.75 | 0.74 | 1.00 | 0.73 | 0.74 | 0.70 | 0.71 | 0.73 | 0.73 | 0.69 | 0.73 | 0.70 |
| 4 | 0.72 | 0.78 | 0.73 | 1.00 | 0.71 | 0.73 | 0.75 | 0.76 | 0.74 | 0.71 | 0.77 | 0.71 |
| 5 | 0.74 | 0.71 | 0.74 | 0.71 | 1.00 | 0.77 | 0.74 | 0.74 | 0.76 | 0.72 | 0.73 | 0.72 |
| 6 | 0.71 | 0.71 | 0.70 | 0.73 | 0.77 | 1.00 | 0.72 | 0.73 | 0.74 | 0.73 | 0.73 | 0.73 |
| 7 | 0.70 | 0.74 | 0.71 | 0.75 | 0.74 | 0.72 | 1.00 | 0.83 | 0.73 | 0.71 | 0.75 | 0.74 |
| 8 | 0.71 | 0.78 | 0.73 | 0.76 | 0.74 | 0.73 | 0.83 | 1.00 | 0.73 | 0.73 | 0.73 | 0.76 |
| 9 | 0.75 | 0.73 | 0.73 | 0.74 | 0.76 | 0.74 | 0.73 | 0.73 | 1.00 | 0.73 | 0.76 | 0.71 |
| 10 | 0.72 | 0.71 | 0.69 | 0.71 | 0.72 | 0.73 | 0.71 | 0.73 | 0.73 | 1.00 | 0.71 | 0.73 |
| 11 | 0.71 | 0.78 | 0.73 | 0.77 | 0.73 | 0.73 | 0.75 | 0.73 | 0.76 | 0.71 | 1.00 | 0.73 |
| 12 | 0.69 | 0.71 | 0.70 | 0.71 | 0.72 | 0.73 | 0.74 | 0.76 | 0.71 | 0.73 | 0.73 | 1.00 |
The table contains GDT_TS values (calculated on the Cα atoms) between the predicted models.
Read more about the global distance test (GDT, also written as GDT_TS to represent "total score") measure.
© Laboratory of Theory of Biopolymers, Faculty of Chemistry, University of Warsaw 2013