Status: Done started: 2018-Jul-31 17:50:14 UTC
| Project Name | |
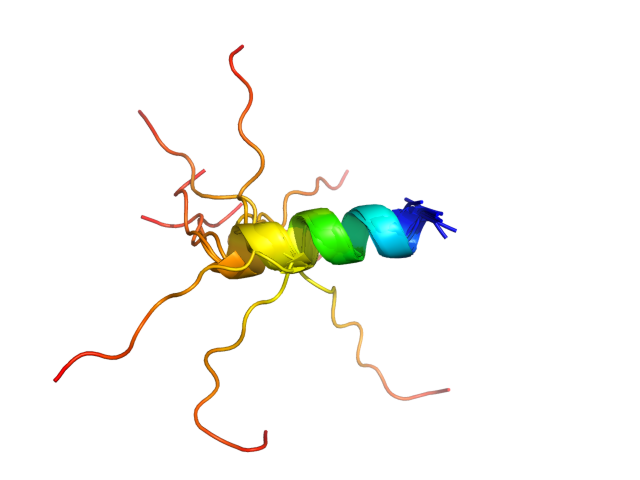
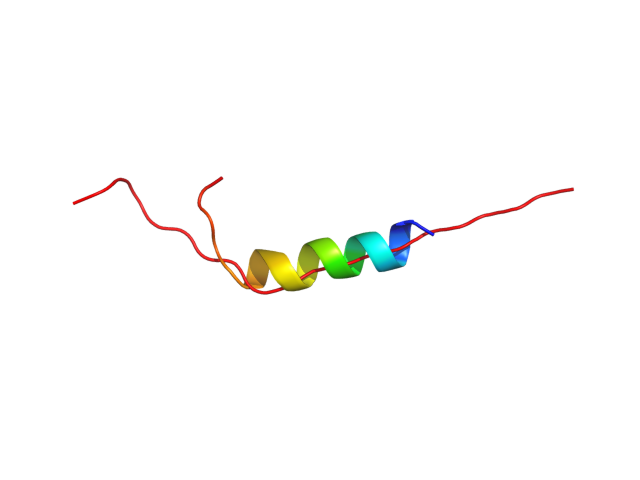
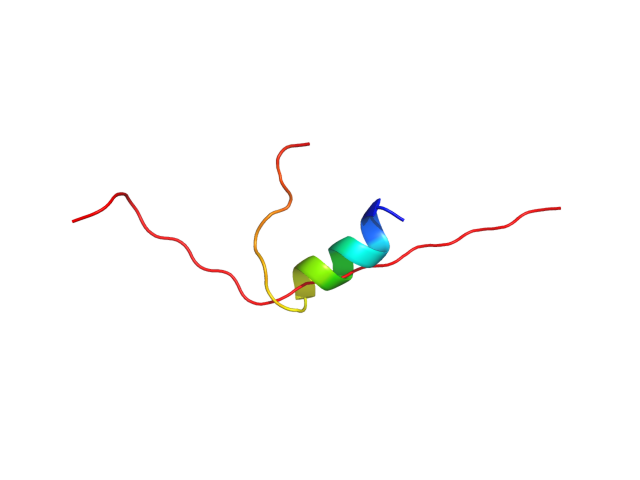
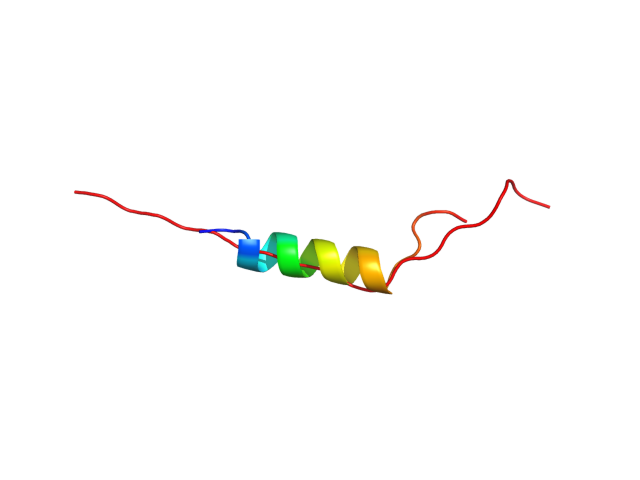
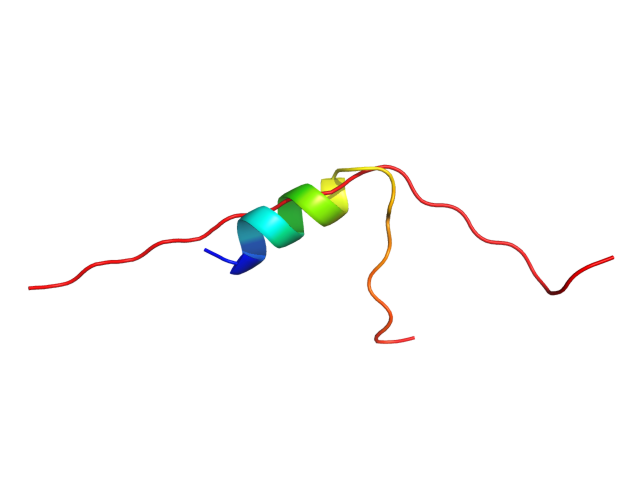
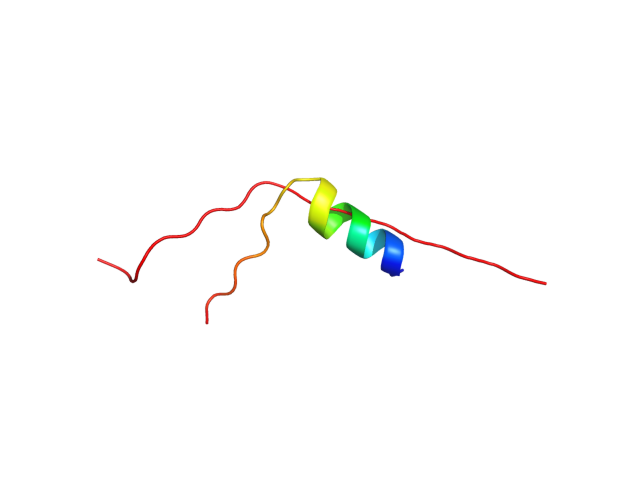
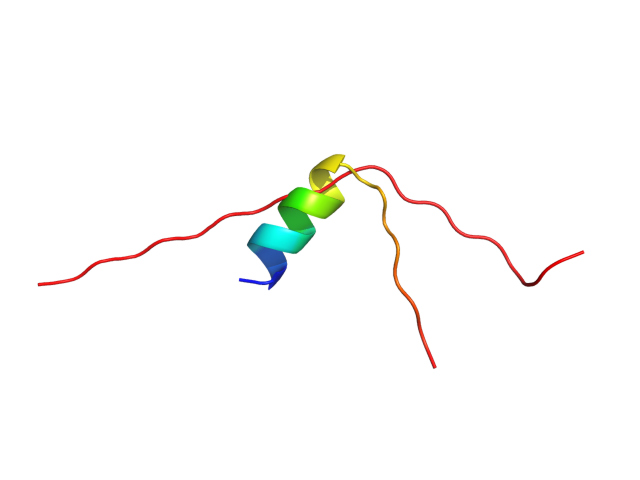
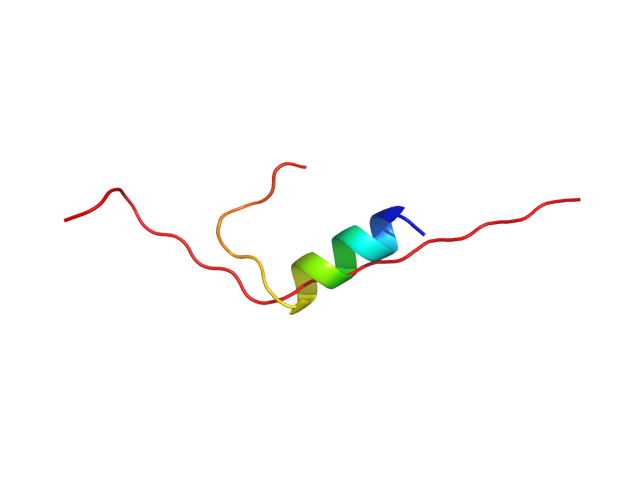
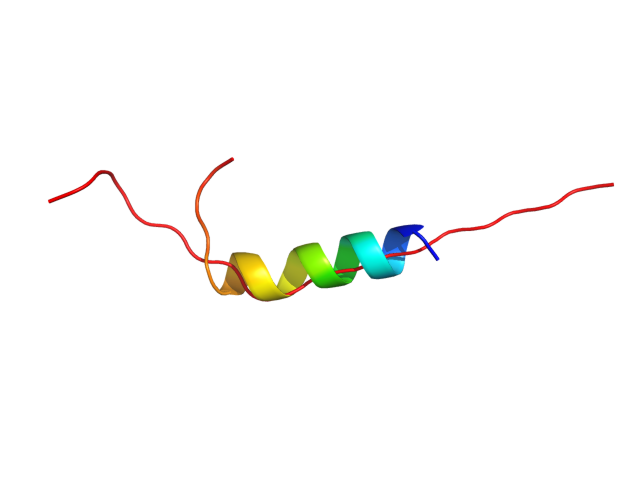
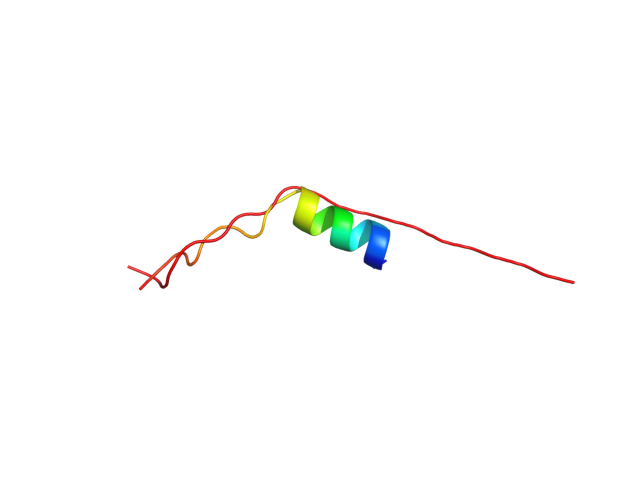
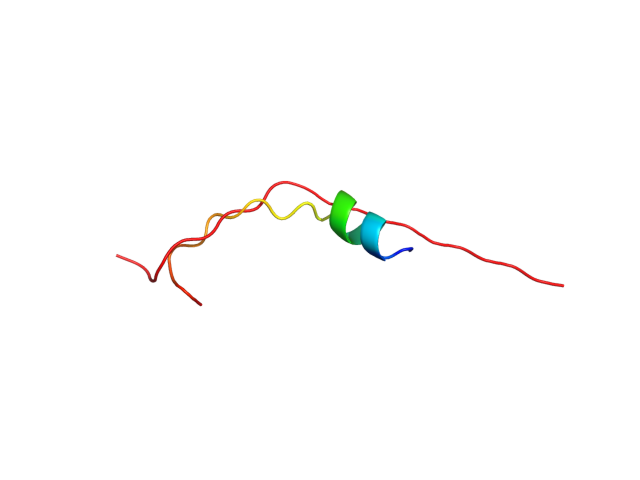
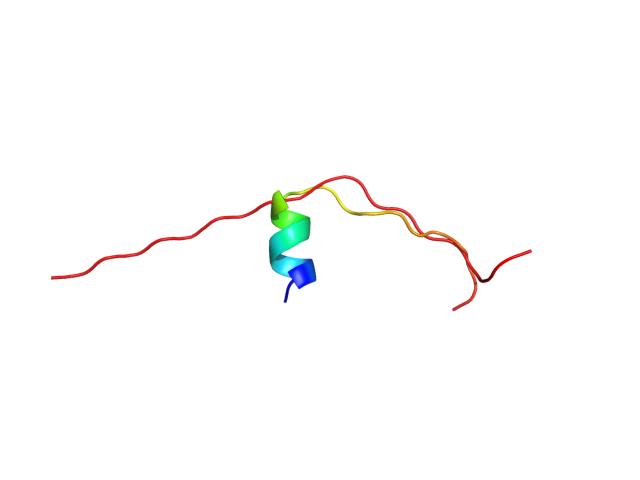
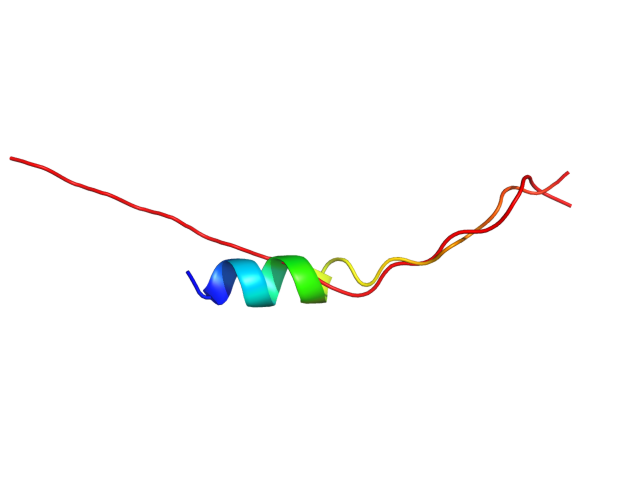
| Sequence | NLYIQWLKDG GPSSGRPPPS |
| Secondary structure | CCCCCCCCCC CCCCCCCCCC |
| Movie from predicted structures | To download the movie, right click on the desired file format:  
|
| Estimated finish time | 2018-Jul-31 22:11 UTC |
| Project Name |
| Project Name |
| Cluster # | 1 | 2 | 3 | 4 | 5 | 6 | 7 | 8 | 9 | 10 | 11 | 12 |
| Cluster density | 98.4 | 96.5 | 82.9 | 77.1 | 69.5 | 64.9 | 60.5 | 57.5 | 48.8 | 25.2 | 22.3 | 20.1 |
| Cluster size | 269 | 249 | 228 | 219 | 181 | 174 | 182 | 166 | 139 | 75 | 64 | 54 |
| Average cluster RMSD | 2.7 | 2.6 | 2.8 | 2.8 | 2.6 | 2.7 | 3.0 | 2.9 | 2.9 | 3.0 | 2.9 | 2.7 |
| # | 1 | 2 | 3 | 4 | 5 | 6 | 7 | 8 | 9 | 10 | 11 | 12 |
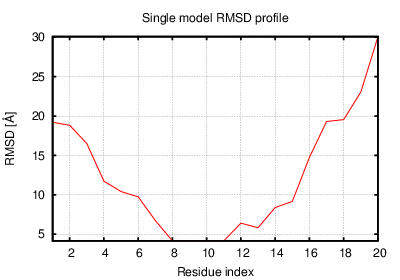
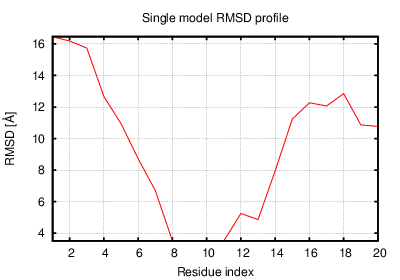
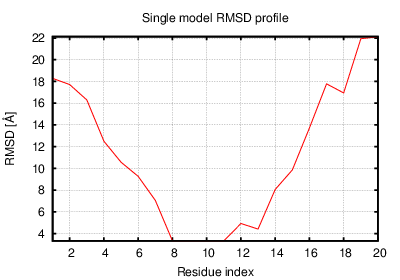
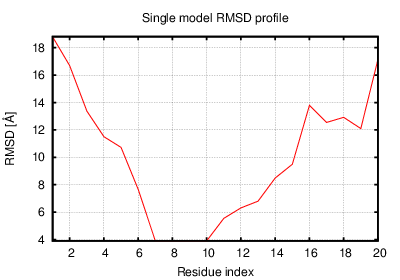
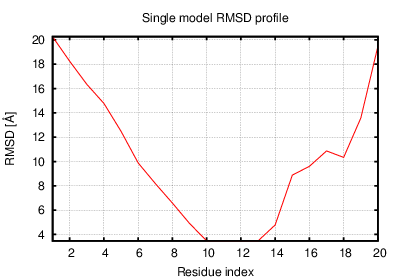
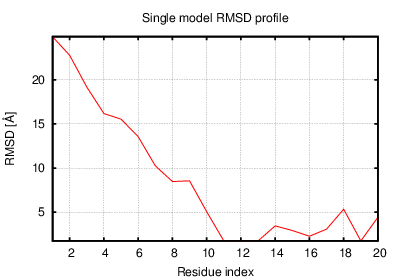
| RMSD | 10.50 | 13.60 | 10.10 | 12.30 | 10.90 | 12.50 | 12.60 | 11.00 | 9.21 | 8.99 | 11.20 | 7.56 |
| GDT_TS | 0.31 | 0.31 | 0.30 | 0.31 | 0.35 | 0.33 | 0.31 | 0.29 | 0.38 | 0.41 | 0.40 | 0.46 |
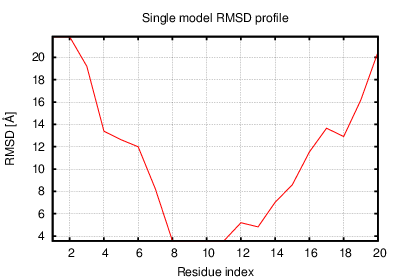
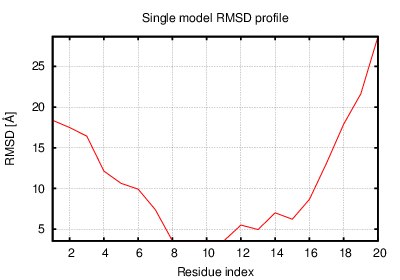
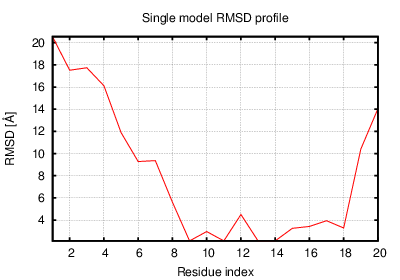
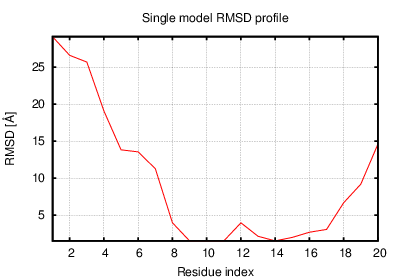
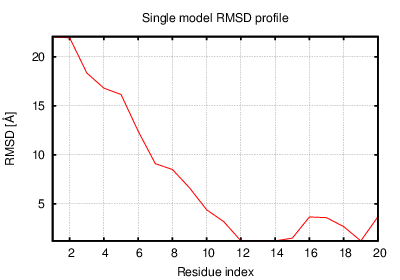
The table contains RMSD and GDT_TS values (calculated on the Cα atoms) between the predicted models and the input structure. Note that GDT_TS metric is intended as a more accurate measurement than the more common RMSD.
Read more about the root-mean-square deviation (RMSD) measure
Read more about the global distance test (GDT, also written as GDT_TS to represent "total score") measure.
| # | 1 | 2 | 3 | 4 | 5 | 6 | 7 | 8 | 9 | 10 | 11 | 12 |
| 1 | 0.00 | 5.10 | 2.02 | 4.21 | 3.51 | 4.35 | 4.22 | 1.32 | 3.45 | 4.11 | 5.13 | 5.56 |
| 2 | 5.10 | 0.00 | 5.90 | 2.33 | 4.01 | 2.35 | 2.38 | 4.47 | 6.15 | 6.45 | 5.13 | 8.76 |
| 3 | 2.02 | 5.90 | 0.00 | 4.51 | 4.00 | 4.86 | 5.17 | 2.67 | 3.28 | 4.39 | 5.53 | 4.68 |
| 4 | 4.21 | 2.33 | 4.51 | 0.00 | 3.30 | 2.02 | 2.78 | 3.61 | 5.11 | 5.48 | 4.74 | 7.40 |
| 5 | 3.51 | 4.01 | 4.00 | 3.30 | 0.00 | 2.68 | 4.26 | 3.76 | 3.14 | 4.95 | 4.67 | 6.24 |
| 6 | 4.35 | 2.35 | 4.86 | 2.02 | 2.68 | 0.00 | 3.40 | 4.06 | 4.69 | 5.54 | 4.24 | 7.41 |
| 7 | 4.22 | 2.38 | 5.17 | 2.78 | 4.26 | 3.40 | 0.00 | 3.41 | 5.83 | 5.53 | 5.10 | 8.11 |
| 8 | 1.32 | 4.47 | 2.67 | 3.61 | 3.76 | 4.06 | 3.41 | 0.00 | 4.23 | 4.22 | 5.13 | 6.11 |
| 9 | 3.45 | 6.15 | 3.28 | 5.11 | 3.14 | 4.69 | 5.83 | 4.23 | 0.00 | 4.18 | 4.69 | 4.46 |
| 10 | 4.11 | 6.45 | 4.39 | 5.48 | 4.95 | 5.54 | 5.53 | 4.22 | 4.18 | 0.00 | 4.01 | 4.17 |
| 11 | 5.13 | 5.13 | 5.53 | 4.74 | 4.67 | 4.24 | 5.10 | 5.13 | 4.69 | 4.01 | 0.00 | 6.18 |
| 12 | 5.56 | 8.76 | 4.68 | 7.40 | 6.24 | 7.41 | 8.11 | 6.11 | 4.46 | 4.17 | 6.18 | 0.00 |
The table contains RMSD values (calculated on the Cα atoms) between the predicted models.
Read more about the root-mean-square deviation (RMSD) measure.
| # | 1 | 2 | 3 | 4 | 5 | 6 | 7 | 8 | 9 | 10 | 11 | 12 |
| 1 | 1.00 | 0.70 | 0.88 | 0.68 | 0.72 | 0.70 | 0.71 | 0.91 | 0.74 | 0.65 | 0.59 | 0.66 |
| 2 | 0.70 | 1.00 | 0.65 | 0.86 | 0.71 | 0.82 | 0.80 | 0.70 | 0.69 | 0.55 | 0.60 | 0.60 |
| 3 | 0.88 | 0.65 | 1.00 | 0.66 | 0.66 | 0.69 | 0.70 | 0.85 | 0.70 | 0.64 | 0.55 | 0.69 |
| 4 | 0.68 | 0.86 | 0.66 | 1.00 | 0.75 | 0.86 | 0.81 | 0.74 | 0.69 | 0.60 | 0.61 | 0.60 |
| 5 | 0.72 | 0.71 | 0.66 | 0.75 | 1.00 | 0.76 | 0.75 | 0.71 | 0.74 | 0.60 | 0.60 | 0.60 |
| 6 | 0.70 | 0.82 | 0.69 | 0.86 | 0.76 | 1.00 | 0.74 | 0.71 | 0.71 | 0.56 | 0.61 | 0.60 |
| 7 | 0.71 | 0.80 | 0.70 | 0.81 | 0.75 | 0.74 | 1.00 | 0.75 | 0.70 | 0.59 | 0.57 | 0.61 |
| 8 | 0.91 | 0.70 | 0.85 | 0.74 | 0.71 | 0.71 | 0.75 | 1.00 | 0.69 | 0.65 | 0.62 | 0.68 |
| 9 | 0.74 | 0.69 | 0.70 | 0.69 | 0.74 | 0.71 | 0.70 | 0.69 | 1.00 | 0.60 | 0.61 | 0.60 |
| 10 | 0.65 | 0.55 | 0.64 | 0.60 | 0.60 | 0.56 | 0.59 | 0.65 | 0.60 | 1.00 | 0.61 | 0.70 |
| 11 | 0.59 | 0.60 | 0.55 | 0.61 | 0.60 | 0.61 | 0.57 | 0.62 | 0.61 | 0.61 | 1.00 | 0.54 |
| 12 | 0.66 | 0.60 | 0.69 | 0.60 | 0.60 | 0.60 | 0.61 | 0.68 | 0.60 | 0.70 | 0.54 | 1.00 |
The table contains GDT_TS values (calculated on the Cα atoms) between the predicted models.
Read more about the global distance test (GDT, also written as GDT_TS to represent "total score") measure.
© Laboratory of Theory of Biopolymers, Faculty of Chemistry, University of Warsaw 2013