Status: Done started: 2018-May-02 09:44:50 UTC
| Project Name | lipPN1 |
| Sequence | STTYPIVLVH GLSGFGDIVG YPYFYGIADA LEKDGHKVFT ASLSAFNSNE VRGEQLWEFV QKVLKETKAK EVNLIGHSQG PLACRYVAAK HAKSIASVTS VNGVNHGSEI ADLVRRIMRK DSVPEYIADA VMKAIGTIIS TFSGNRGNPQ DAVAALEALT TENVTEFNKK YPQGLPAVRG GEGKEIVNGV HYYSFGSYIQ GLIAGEKGNL LDPTHAAMRI LSAFFSEREN DGLVGRTSMR LGKLIKDDYA EDHLDMVNQV AGLVGRGEDI IAIYTNHANF LASKKL |
| Secondary structure | CCCCCEEEEE ECCCHHHHHC CCCCCCHHHH HHHCCCCEEE EEECCCCCHH HHHHHHHHHH HHHHHHHCCC CEEEEEECCH HHHHHHHHHH CCCCEEEEEE ECCCCCCCHH HHHHHHHHHC CCCCHHHHHH HHHHHHHHHH HHHCCCCCCC CCHHHHCCCC HHHHHHHHHH CCCCCCCCCC CCCCCEECCE EEEEEEECCC CCCCCCCCCC CCHHHHHHHH HHCCCCCCCC CCCCCCCCCC CCEEEEEEEC CCCCCCCCCC CCCCCCCCCH HHHHHHHHHH HHHCCC |
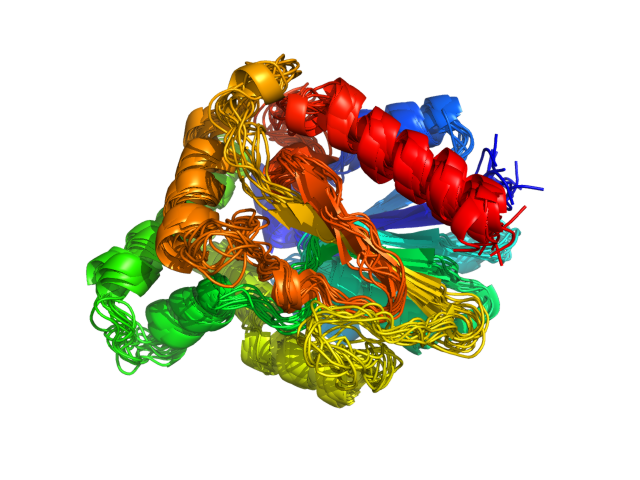
| Movie from predicted structures | To download the movie, right click on the desired file format:  
|
| Estimated finish time | 2018-May-02 14:41 UTC |
| Project Name | lipPN1 |


| Project Name | lipPN1 |
| Cluster # | 1 | 2 | 3 | 4 | 5 | 6 | 7 | 8 | 9 | 10 | 11 | 12 |
| Cluster density | 283.1 | 174.8 | 150.6 | 146.2 | 140.0 | 136.4 | 133.6 | 133.1 | 133.0 | 119.1 | 111.3 | 87.7 |
| Cluster size | 338 | 205 | 166 | 158 | 158 | 156 | 156 | 153 | 158 | 138 | 117 | 97 |
| Average cluster RMSD | 1.2 | 1.2 | 1.1 | 1.1 | 1.1 | 1.1 | 1.2 | 1.1 | 1.2 | 1.2 | 1.1 | 1.1 |
| # | 1 | 2 | 3 | 4 | 5 | 6 | 7 | 8 | 9 | 10 | 11 | 12 |
| RMSD | 2.80 | 2.66 | 2.36 | 2.48 | 2.70 | 2.61 | 2.88 | 2.59 | 2.92 | 2.69 | 2.77 | 2.61 |
| GDT_TS | 0.68 | 0.69 | 0.72 | 0.72 | 0.69 | 0.69 | 0.66 | 0.70 | 0.67 | 0.69 | 0.68 | 0.68 |
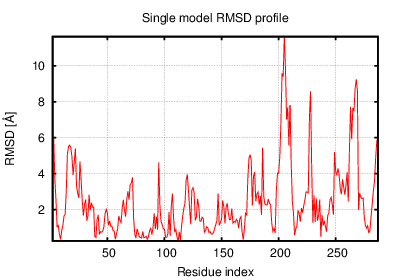
The table contains RMSD and GDT_TS values (calculated on the Cα atoms) between the predicted models and the input structure. Note that GDT_TS metric is intended as a more accurate measurement than the more common RMSD.
Read more about the root-mean-square deviation (RMSD) measure
Read more about the global distance test (GDT, also written as GDT_TS to represent "total score") measure.
| # | 1 | 2 | 3 | 4 | 5 | 6 | 7 | 8 | 9 | 10 | 11 | 12 |
| 1 | 0.00 | 2.09 | 2.22 | 1.72 | 2.06 | 2.23 | 1.84 | 2.04 | 2.20 | 1.65 | 2.13 | 2.19 |
| 2 | 2.09 | 0.00 | 2.17 | 2.07 | 1.99 | 2.00 | 1.76 | 2.19 | 1.86 | 2.09 | 1.91 | 2.03 |
| 3 | 2.22 | 2.17 | 0.00 | 1.86 | 2.19 | 2.28 | 2.36 | 2.01 | 2.40 | 2.26 | 2.33 | 2.41 |
| 4 | 1.72 | 2.07 | 1.86 | 0.00 | 1.92 | 2.13 | 2.01 | 2.01 | 2.12 | 1.68 | 2.14 | 1.96 |
| 5 | 2.06 | 1.99 | 2.19 | 1.92 | 0.00 | 2.10 | 1.99 | 2.13 | 2.18 | 2.18 | 2.08 | 1.88 |
| 6 | 2.23 | 2.00 | 2.28 | 2.13 | 2.10 | 0.00 | 2.03 | 2.27 | 2.18 | 2.08 | 2.01 | 1.90 |
| 7 | 1.84 | 1.76 | 2.36 | 2.01 | 1.99 | 2.03 | 0.00 | 2.22 | 2.02 | 1.95 | 1.82 | 2.11 |
| 8 | 2.04 | 2.19 | 2.01 | 2.01 | 2.13 | 2.27 | 2.22 | 0.00 | 2.30 | 2.22 | 2.12 | 2.20 |
| 9 | 2.20 | 1.86 | 2.40 | 2.12 | 2.18 | 2.18 | 2.02 | 2.30 | 0.00 | 2.14 | 2.09 | 2.18 |
| 10 | 1.65 | 2.09 | 2.26 | 1.68 | 2.18 | 2.08 | 1.95 | 2.22 | 2.14 | 0.00 | 2.21 | 2.17 |
| 11 | 2.13 | 1.91 | 2.33 | 2.14 | 2.08 | 2.01 | 1.82 | 2.12 | 2.09 | 2.21 | 0.00 | 1.97 |
| 12 | 2.19 | 2.03 | 2.41 | 1.96 | 1.88 | 1.90 | 2.11 | 2.20 | 2.18 | 2.17 | 1.97 | 0.00 |
The table contains RMSD values (calculated on the Cα atoms) between the predicted models.
Read more about the root-mean-square deviation (RMSD) measure.
| # | 1 | 2 | 3 | 4 | 5 | 6 | 7 | 8 | 9 | 10 | 11 | 12 |
| 1 | 1.00 | 0.75 | 0.73 | 0.79 | 0.75 | 0.70 | 0.77 | 0.74 | 0.71 | 0.80 | 0.72 | 0.72 |
| 2 | 0.75 | 1.00 | 0.71 | 0.74 | 0.74 | 0.74 | 0.80 | 0.76 | 0.78 | 0.75 | 0.77 | 0.76 |
| 3 | 0.73 | 0.71 | 1.00 | 0.79 | 0.71 | 0.70 | 0.72 | 0.76 | 0.69 | 0.74 | 0.71 | 0.70 |
| 4 | 0.79 | 0.74 | 0.79 | 1.00 | 0.76 | 0.72 | 0.75 | 0.74 | 0.72 | 0.79 | 0.71 | 0.76 |
| 5 | 0.75 | 0.74 | 0.71 | 0.76 | 1.00 | 0.76 | 0.75 | 0.72 | 0.73 | 0.73 | 0.74 | 0.81 |
| 6 | 0.70 | 0.74 | 0.70 | 0.72 | 0.76 | 1.00 | 0.73 | 0.73 | 0.74 | 0.72 | 0.73 | 0.76 |
| 7 | 0.77 | 0.80 | 0.72 | 0.75 | 0.75 | 0.73 | 1.00 | 0.72 | 0.74 | 0.75 | 0.77 | 0.73 |
| 8 | 0.74 | 0.76 | 0.76 | 0.74 | 0.72 | 0.73 | 0.72 | 1.00 | 0.73 | 0.71 | 0.73 | 0.73 |
| 9 | 0.71 | 0.78 | 0.69 | 0.72 | 0.73 | 0.74 | 0.74 | 0.73 | 1.00 | 0.73 | 0.72 | 0.73 |
| 10 | 0.80 | 0.75 | 0.74 | 0.79 | 0.73 | 0.72 | 0.75 | 0.71 | 0.73 | 1.00 | 0.71 | 0.71 |
| 11 | 0.72 | 0.77 | 0.71 | 0.71 | 0.74 | 0.73 | 0.77 | 0.73 | 0.72 | 0.71 | 1.00 | 0.73 |
| 12 | 0.72 | 0.76 | 0.70 | 0.76 | 0.81 | 0.76 | 0.73 | 0.73 | 0.73 | 0.71 | 0.73 | 1.00 |
The table contains GDT_TS values (calculated on the Cα atoms) between the predicted models.
Read more about the global distance test (GDT, also written as GDT_TS to represent "total score") measure.
© Laboratory of Theory of Biopolymers, Faculty of Chemistry, University of Warsaw 2013