Status: Done started: 2018-Apr-26 08:30:53 UTC
| Project Name | 9 |
| Sequence | IVGGYTCAAN SIPYQVSLNS GSHFCGGSLI NSQWVVSAAH CYKSRIQVRL GEHNIDVLEG NEQFINAAKI ITHPDIMLIK LSSPATLNSR VATVSLPRSC AAAGTECLIS GWGNTKSSGS SYPSLLQCLK APVLSDSSCK SSYPGQITGN MICVGFLEGG KDSCQGDSGG PVVCNGQLQG IVSWGYGCAQ KNKPGVYTKV CNYVNWIQQT IAAN |
| Secondary structure | CCCCEECCCC CCCCEEEEEC CCEEEEEEEE ECCEEEEECC CCCCCCEEEE CCCCCCCCCC CCEEEEEEEE EECCCEEEEE ECCCCCCCCC CCCCCCCCCC CCCCCEEEEE ECCCCCCCCC CCCCCCEEEE EECCCHHHHH HHCCCCCCCC EEEECCCCCC CCCCCCCCCC EEEECCEEEE EEEECCCCCC CCCCEEEEEC CCCHHHHHHH HHCC |
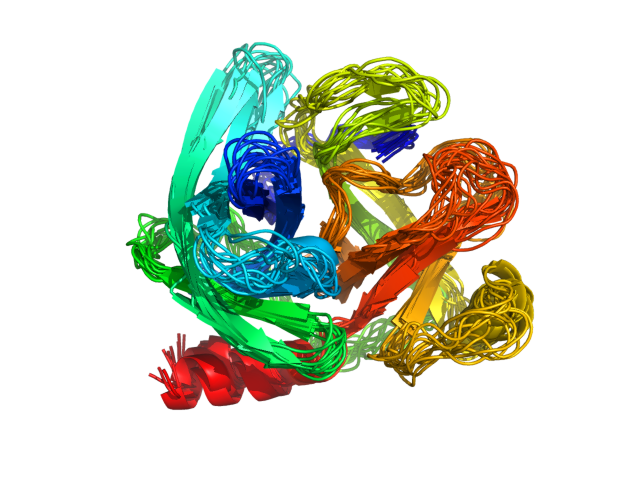
| Movie from predicted structures | To download the movie, right click on the desired file format:  
|
| Estimated finish time | 2018-Apr-26 13:18 UTC |
| Project Name | 9 |


| Project Name | 9 |
| Cluster # | 1 | 2 | 3 | 4 | 5 | 6 | 7 | 8 | 9 | 10 | 11 | 12 |
| Cluster density | 211.5 | 210.3 | 155.1 | 133.2 | 132.6 | 126.9 | 115.7 | 114.0 | 94.8 | 76.4 | 70.7 | 48.6 |
| Cluster size | 279 | 288 | 200 | 187 | 171 | 179 | 155 | 151 | 139 | 91 | 98 | 62 |
| Average cluster RMSD | 1.3 | 1.4 | 1.3 | 1.4 | 1.3 | 1.4 | 1.3 | 1.3 | 1.5 | 1.2 | 1.4 | 1.3 |
| # | 1 | 2 | 3 | 4 | 5 | 6 | 7 | 8 | 9 | 10 | 11 | 12 |
| RMSD | 3.16 | 2.89 | 3.07 | 3.24 | 3.03 | 3.07 | 3.06 | 2.91 | 3.07 | 2.92 | 2.85 | 2.62 |
| GDT_TS | 0.66 | 0.68 | 0.65 | 0.65 | 0.66 | 0.64 | 0.67 | 0.69 | 0.65 | 0.67 | 0.66 | 0.68 |
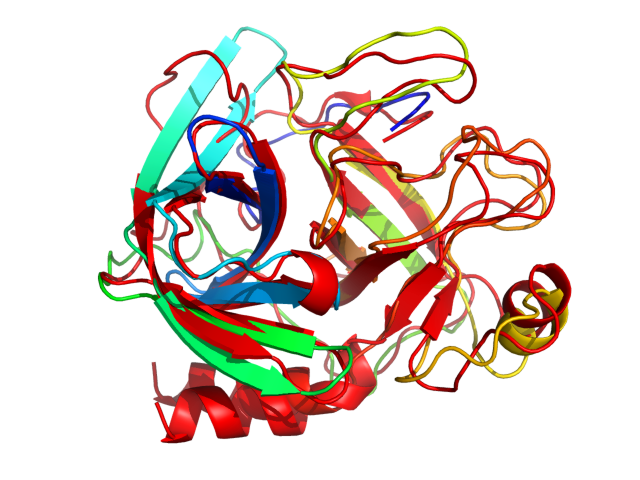
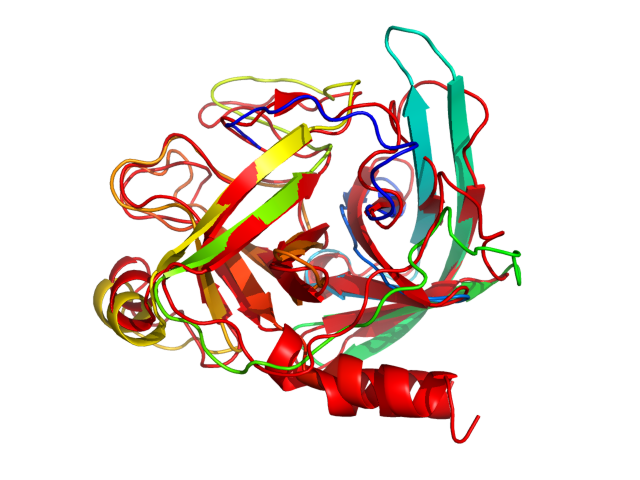
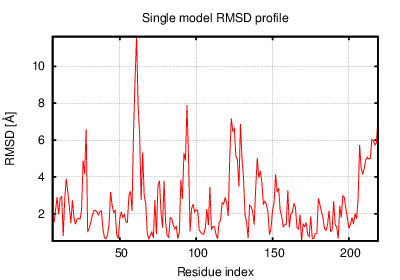
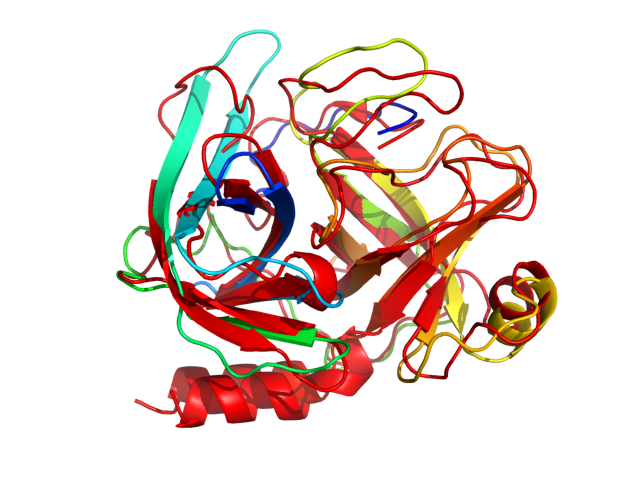
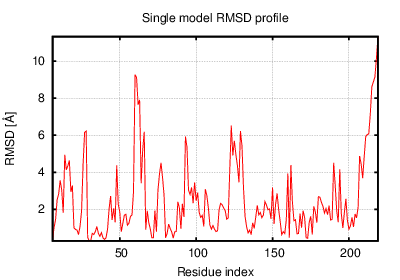
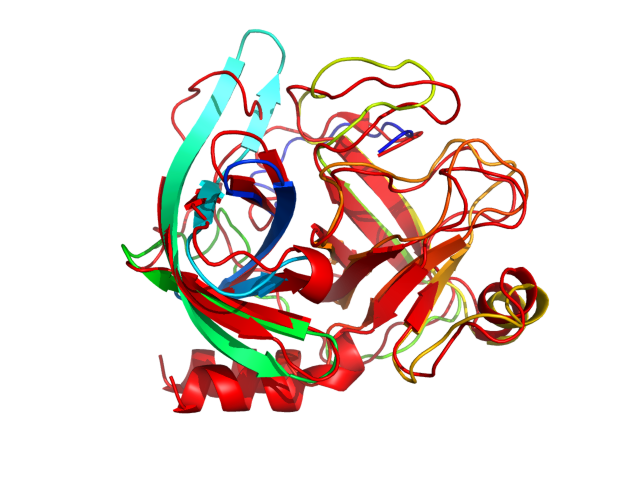
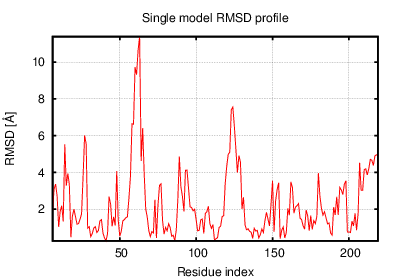
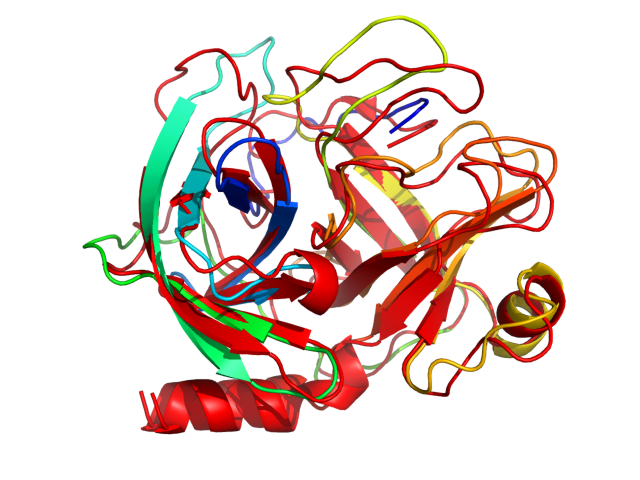
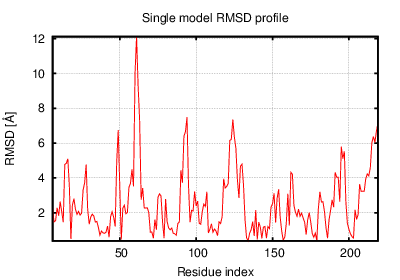
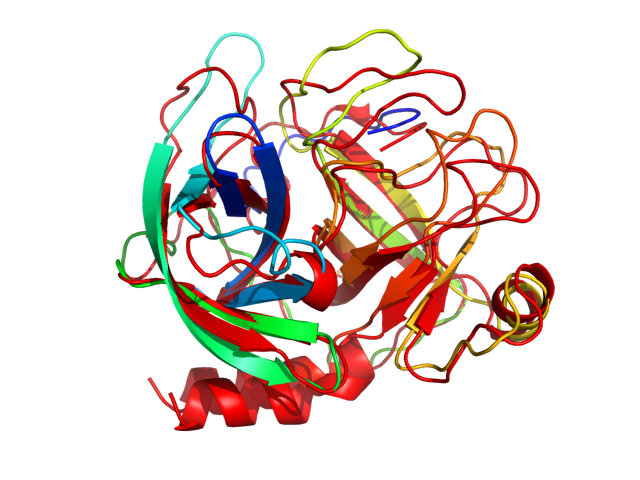
The table contains RMSD and GDT_TS values (calculated on the Cα atoms) between the predicted models and the input structure. Note that GDT_TS metric is intended as a more accurate measurement than the more common RMSD.
Read more about the root-mean-square deviation (RMSD) measure
Read more about the global distance test (GDT, also written as GDT_TS to represent "total score") measure.
| # | 1 | 2 | 3 | 4 | 5 | 6 | 7 | 8 | 9 | 10 | 11 | 12 |
| 1 | 0.00 | 1.96 | 2.05 | 2.02 | 2.07 | 2.27 | 2.19 | 2.16 | 2.16 | 2.31 | 2.03 | 2.59 |
| 2 | 1.96 | 0.00 | 2.16 | 2.16 | 2.06 | 2.13 | 2.35 | 2.26 | 2.30 | 2.65 | 2.23 | 2.64 |
| 3 | 2.05 | 2.16 | 0.00 | 2.06 | 2.07 | 1.77 | 2.01 | 2.37 | 2.19 | 2.28 | 1.98 | 2.34 |
| 4 | 2.02 | 2.16 | 2.06 | 0.00 | 1.93 | 1.79 | 2.02 | 2.10 | 1.99 | 2.18 | 1.95 | 2.52 |
| 5 | 2.07 | 2.06 | 2.07 | 1.93 | 0.00 | 2.12 | 1.98 | 2.25 | 2.41 | 2.26 | 2.00 | 2.46 |
| 6 | 2.27 | 2.13 | 1.77 | 1.79 | 2.12 | 0.00 | 1.93 | 2.12 | 1.94 | 2.19 | 2.06 | 2.34 |
| 7 | 2.19 | 2.35 | 2.01 | 2.02 | 1.98 | 1.93 | 0.00 | 2.13 | 2.12 | 2.33 | 1.88 | 2.41 |
| 8 | 2.16 | 2.26 | 2.37 | 2.10 | 2.25 | 2.12 | 2.13 | 0.00 | 2.31 | 1.97 | 2.17 | 2.13 |
| 9 | 2.16 | 2.30 | 2.19 | 1.99 | 2.41 | 1.94 | 2.12 | 2.31 | 0.00 | 2.47 | 1.86 | 2.37 |
| 10 | 2.31 | 2.65 | 2.28 | 2.18 | 2.26 | 2.19 | 2.33 | 1.97 | 2.47 | 0.00 | 2.22 | 2.15 |
| 11 | 2.03 | 2.23 | 1.98 | 1.95 | 2.00 | 2.06 | 1.88 | 2.17 | 1.86 | 2.22 | 0.00 | 2.31 |
| 12 | 2.59 | 2.64 | 2.34 | 2.52 | 2.46 | 2.34 | 2.41 | 2.13 | 2.37 | 2.15 | 2.31 | 0.00 |
The table contains RMSD values (calculated on the Cα atoms) between the predicted models.
Read more about the root-mean-square deviation (RMSD) measure.
| # | 1 | 2 | 3 | 4 | 5 | 6 | 7 | 8 | 9 | 10 | 11 | 12 |
| 1 | 1.00 | 0.76 | 0.73 | 0.75 | 0.75 | 0.72 | 0.74 | 0.72 | 0.75 | 0.72 | 0.76 | 0.69 |
| 2 | 0.76 | 1.00 | 0.72 | 0.73 | 0.74 | 0.73 | 0.69 | 0.72 | 0.71 | 0.69 | 0.72 | 0.67 |
| 3 | 0.73 | 0.72 | 1.00 | 0.76 | 0.73 | 0.79 | 0.74 | 0.70 | 0.73 | 0.73 | 0.72 | 0.73 |
| 4 | 0.75 | 0.73 | 0.76 | 1.00 | 0.74 | 0.83 | 0.78 | 0.76 | 0.79 | 0.74 | 0.78 | 0.71 |
| 5 | 0.75 | 0.74 | 0.73 | 0.74 | 1.00 | 0.72 | 0.76 | 0.71 | 0.71 | 0.71 | 0.74 | 0.70 |
| 6 | 0.72 | 0.73 | 0.79 | 0.83 | 0.72 | 1.00 | 0.76 | 0.74 | 0.78 | 0.72 | 0.75 | 0.71 |
| 7 | 0.74 | 0.69 | 0.74 | 0.78 | 0.76 | 0.76 | 1.00 | 0.75 | 0.75 | 0.75 | 0.79 | 0.70 |
| 8 | 0.72 | 0.72 | 0.70 | 0.76 | 0.71 | 0.74 | 0.75 | 1.00 | 0.72 | 0.77 | 0.74 | 0.76 |
| 9 | 0.75 | 0.71 | 0.73 | 0.79 | 0.71 | 0.78 | 0.75 | 0.72 | 1.00 | 0.71 | 0.80 | 0.71 |
| 10 | 0.72 | 0.69 | 0.73 | 0.74 | 0.71 | 0.72 | 0.75 | 0.77 | 0.71 | 1.00 | 0.72 | 0.73 |
| 11 | 0.76 | 0.72 | 0.72 | 0.78 | 0.74 | 0.75 | 0.79 | 0.74 | 0.80 | 0.72 | 1.00 | 0.70 |
| 12 | 0.69 | 0.67 | 0.73 | 0.71 | 0.70 | 0.71 | 0.70 | 0.76 | 0.71 | 0.73 | 0.70 | 1.00 |
The table contains GDT_TS values (calculated on the Cα atoms) between the predicted models.
Read more about the global distance test (GDT, also written as GDT_TS to represent "total score") measure.
© Laboratory of Theory of Biopolymers, Faculty of Chemistry, University of Warsaw 2013