Status: Done started: 2018-Oct-24 21:50:59 UTC
| Project Name | |
| Sequence | SMGSNELDEL ASGINRMAET LQSAQEEMQH NIDQATEDVR QNLETIEIQN IELDLARKEA LEASRIKSEF LANMSHEIRT PLNGILGFTN LLQKSELSPR QQDYLTTIQK SAESLLGIIN EILDFSKIEA GKLVLENLPF NLRDLIQDAL TMLAPAAHEK QLELVSLVYR DTPIQLQGDP QRLKQILTNL VGNAIKFTQG GTVAVRAMLE DESDDRAQLR ISVQDTGIGL SEEDQQALFK AFSQADNSLS RQAGGTGLGL VISKRLIEQM GGEIGVDSTP GEGAEFWISL SLPKS |
| Secondary structure | CHHHHHHHHH HHHCCCCHHH HHCCCCCCHH HHHHHHHHHH HHHHHHHHHH HHHHHHHHHH HHHHHHHHHH HHHHHHHHHH HHHHHHHHHH HHHCCCCCHH HHHHHHHHHH HHHHHHHHHH HHHHHHHHHC CCCCCCCEEE EHHHHHHHHH HHCHHHHHCC CEEEEEEECC CCCCEEEECH HHHHHHHHHH HHHHHHHCCC EEEEEEEEEE EECCCEEEEE EEEEECCCCC CHHHHHHHHH HHHHHHHHHH HCCCCCCHHH HHHHHHHHHC CCEEEEECCC CCCEEEEEEE EEECC |
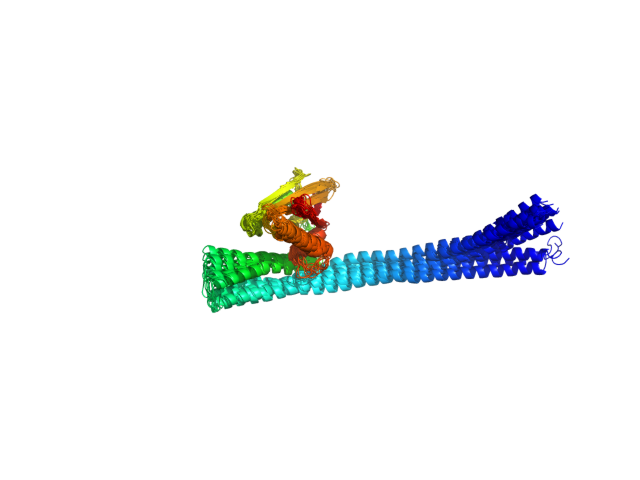
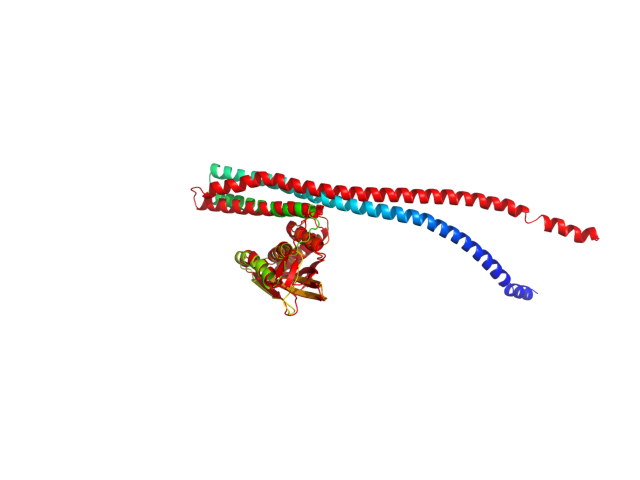
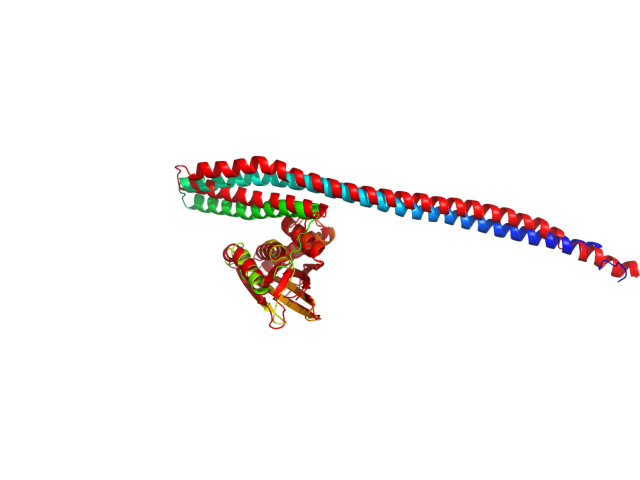
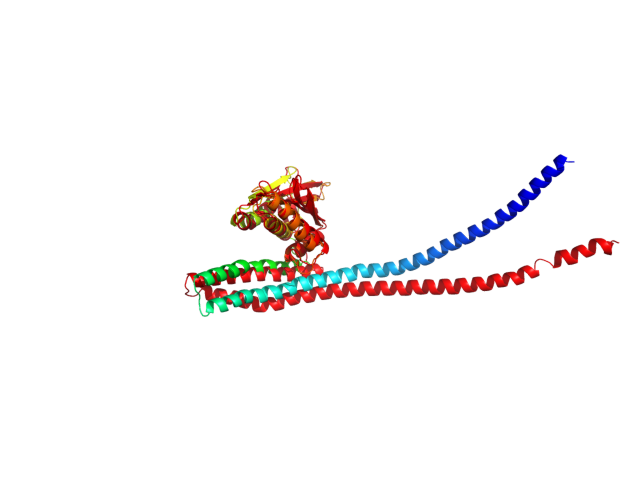
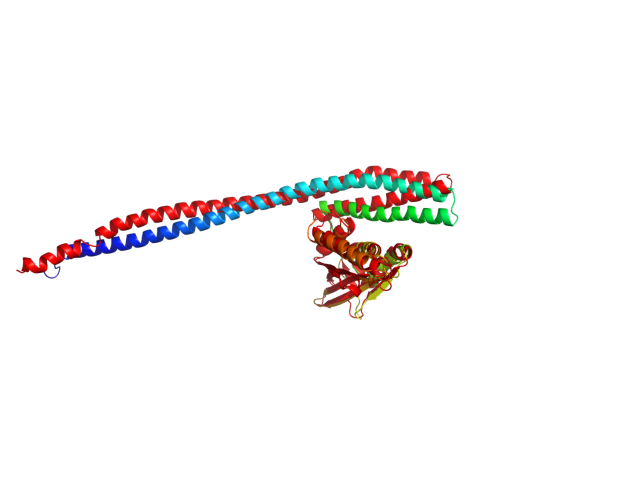
| Movie from predicted structures | To download the movie, right click on the desired file format:  
|
| Estimated finish time | 2018-Oct-25 02:48 UTC |
| Project Name |


| Project Name |
| Cluster # | 1 | 2 | 3 | 4 | 5 | 6 | 7 | 8 | 9 | 10 | 11 | 12 |
| Cluster density | 206.4 | 192.6 | 149.2 | 134.1 | 132.1 | 124.6 | 109.5 | 109.3 | 109.1 | 108.7 | 108.0 | 95.1 |
| Cluster size | 269 | 226 | 195 | 152 | 162 | 200 | 123 | 128 | 132 | 127 | 163 | 123 |
| Average cluster RMSD | 1.3 | 1.2 | 1.3 | 1.1 | 1.2 | 1.6 | 1.1 | 1.2 | 1.2 | 1.2 | 1.5 | 1.3 |
| # | 1 | 2 | 3 | 4 | 5 | 6 | 7 | 8 | 9 | 10 | 11 | 12 |
| RMSD | 5.45 | 5.65 | 4.27 | 6.88 | 5.58 | 3.93 | 7.48 | 6.30 | 6.96 | 5.29 | 4.35 | 7.60 |
| GDT_TS | 0.52 | 0.54 | 0.56 | 0.53 | 0.51 | 0.57 | 0.46 | 0.53 | 0.50 | 0.51 | 0.54 | 0.50 |
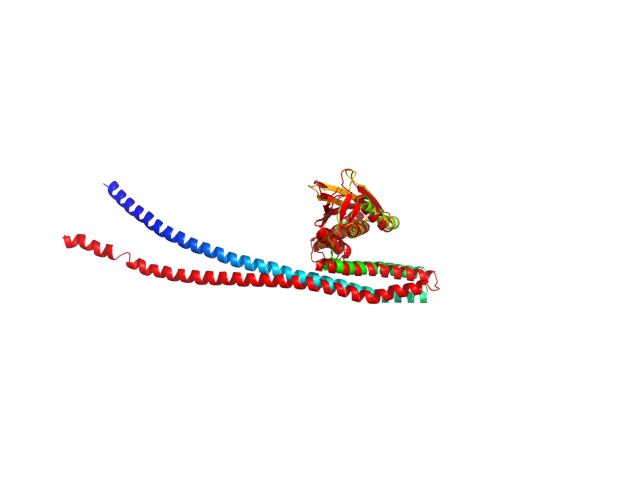
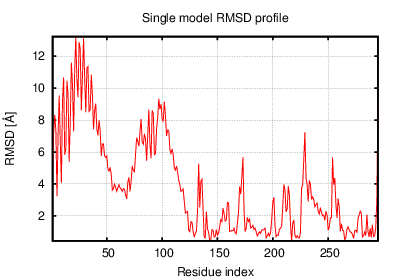
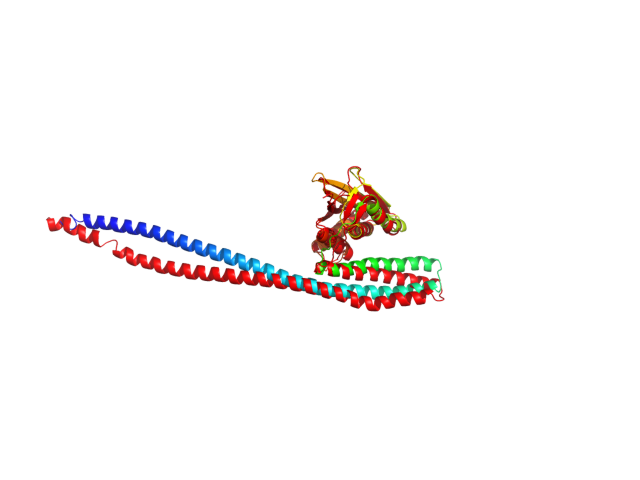
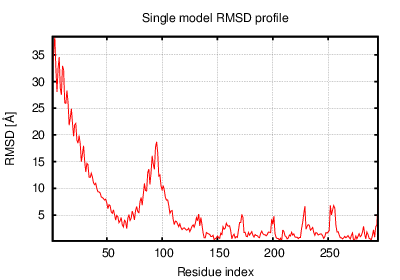
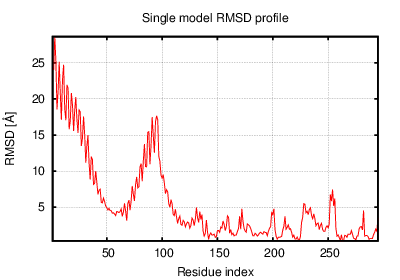
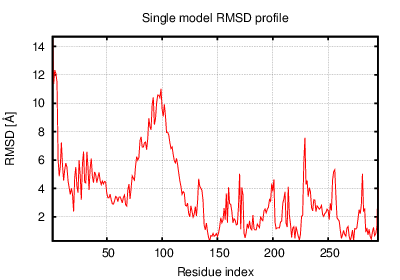
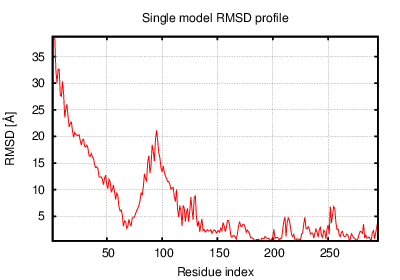
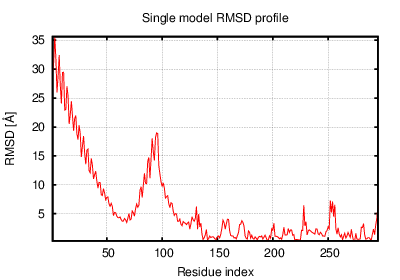
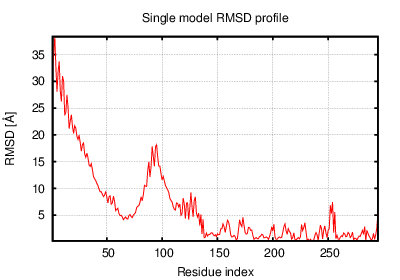
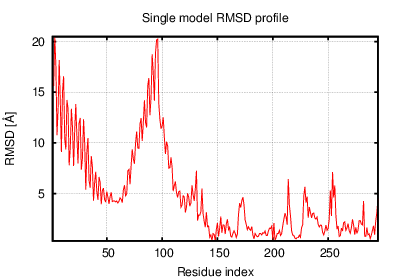
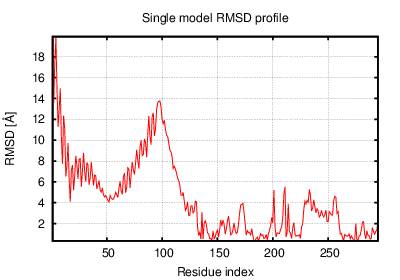
The table contains RMSD and GDT_TS values (calculated on the Cα atoms) between the predicted models and the input structure. Note that GDT_TS metric is intended as a more accurate measurement than the more common RMSD.
Read more about the root-mean-square deviation (RMSD) measure
Read more about the global distance test (GDT, also written as GDT_TS to represent "total score") measure.
| # | 1 | 2 | 3 | 4 | 5 | 6 | 7 | 8 | 9 | 10 | 11 | 12 |
| 1 | 0.00 | 2.48 | 3.27 | 3.97 | 2.27 | 3.73 | 4.66 | 3.10 | 3.92 | 2.27 | 3.89 | 4.64 |
| 2 | 2.48 | 0.00 | 3.81 | 2.53 | 1.77 | 4.56 | 3.40 | 1.93 | 3.11 | 2.04 | 5.00 | 3.60 |
| 3 | 3.27 | 3.81 | 0.00 | 5.28 | 3.73 | 2.68 | 5.75 | 4.64 | 5.50 | 3.28 | 2.72 | 6.05 |
| 4 | 3.97 | 2.53 | 5.28 | 0.00 | 2.93 | 6.17 | 2.99 | 1.93 | 2.85 | 3.52 | 6.77 | 2.89 |
| 5 | 2.27 | 1.77 | 3.73 | 2.93 | 0.00 | 4.52 | 4.01 | 2.09 | 3.47 | 1.82 | 4.75 | 4.07 |
| 6 | 3.73 | 4.56 | 2.68 | 6.17 | 4.52 | 0.00 | 6.38 | 5.36 | 6.01 | 3.95 | 2.32 | 6.56 |
| 7 | 4.66 | 3.40 | 5.75 | 2.99 | 4.01 | 6.38 | 0.00 | 3.03 | 2.29 | 4.23 | 7.03 | 1.95 |
| 8 | 3.10 | 1.93 | 4.64 | 1.93 | 2.09 | 5.36 | 3.03 | 0.00 | 2.51 | 2.85 | 5.84 | 3.01 |
| 9 | 3.92 | 3.11 | 5.50 | 2.85 | 3.47 | 6.01 | 2.29 | 2.51 | 0.00 | 3.95 | 6.63 | 1.87 |
| 10 | 2.27 | 2.04 | 3.28 | 3.52 | 1.82 | 3.95 | 4.23 | 2.85 | 3.95 | 0.00 | 4.21 | 4.39 |
| 11 | 3.89 | 5.00 | 2.72 | 6.77 | 4.75 | 2.32 | 7.03 | 5.84 | 6.63 | 4.21 | 0.00 | 7.28 |
| 12 | 4.64 | 3.60 | 6.05 | 2.89 | 4.07 | 6.56 | 1.95 | 3.01 | 1.87 | 4.39 | 7.28 | 0.00 |
The table contains RMSD values (calculated on the Cα atoms) between the predicted models.
Read more about the root-mean-square deviation (RMSD) measure.
| # | 1 | 2 | 3 | 4 | 5 | 6 | 7 | 8 | 9 | 10 | 11 | 12 |
| 1 | 1.00 | 0.70 | 0.73 | 0.65 | 0.72 | 0.72 | 0.56 | 0.64 | 0.59 | 0.74 | 0.71 | 0.56 |
| 2 | 0.70 | 1.00 | 0.68 | 0.74 | 0.79 | 0.64 | 0.61 | 0.76 | 0.63 | 0.75 | 0.62 | 0.64 |
| 3 | 0.73 | 0.68 | 1.00 | 0.61 | 0.65 | 0.76 | 0.56 | 0.62 | 0.56 | 0.69 | 0.76 | 0.56 |
| 4 | 0.65 | 0.74 | 0.61 | 1.00 | 0.73 | 0.60 | 0.64 | 0.84 | 0.68 | 0.66 | 0.58 | 0.65 |
| 5 | 0.72 | 0.79 | 0.65 | 0.73 | 1.00 | 0.62 | 0.59 | 0.76 | 0.60 | 0.77 | 0.64 | 0.60 |
| 6 | 0.72 | 0.64 | 0.76 | 0.60 | 0.62 | 1.00 | 0.54 | 0.59 | 0.55 | 0.64 | 0.75 | 0.54 |
| 7 | 0.56 | 0.61 | 0.56 | 0.64 | 0.59 | 0.54 | 1.00 | 0.64 | 0.73 | 0.58 | 0.55 | 0.77 |
| 8 | 0.64 | 0.76 | 0.62 | 0.84 | 0.76 | 0.59 | 0.64 | 1.00 | 0.70 | 0.65 | 0.58 | 0.65 |
| 9 | 0.59 | 0.63 | 0.56 | 0.68 | 0.60 | 0.55 | 0.73 | 0.70 | 1.00 | 0.60 | 0.53 | 0.80 |
| 10 | 0.74 | 0.75 | 0.69 | 0.66 | 0.77 | 0.64 | 0.58 | 0.65 | 0.60 | 1.00 | 0.65 | 0.59 |
| 11 | 0.71 | 0.62 | 0.76 | 0.58 | 0.64 | 0.75 | 0.55 | 0.58 | 0.53 | 0.65 | 1.00 | 0.55 |
| 12 | 0.56 | 0.64 | 0.56 | 0.65 | 0.60 | 0.54 | 0.77 | 0.65 | 0.80 | 0.59 | 0.55 | 1.00 |
The table contains GDT_TS values (calculated on the Cα atoms) between the predicted models.
Read more about the global distance test (GDT, also written as GDT_TS to represent "total score") measure.
© Laboratory of Theory of Biopolymers, Faculty of Chemistry, University of Warsaw 2013