Status: Done started: 2018-Jul-11 12:56:36 UTC
| Project Name | |
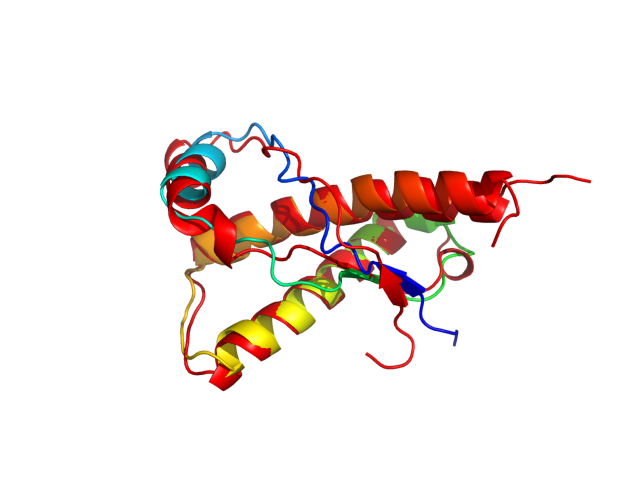
| Sequence | LGGYMLGSAM SRPLIHFGND YEDCYYRENM HRYPNQVYYR PVDQYSNQNN FVHDCVNITV KQHTVTTTTK GENFTETDIK IMERVVEQMC ITQYQRESQA YYQRGA |
| Secondary structure | CCCCEECCCC CCCCCCCCCH HHHHHHHHCC CCCCCCCEEC CCCCCCCCHH HHHHHHHHHH HHHHHHHHHC CCCCCHHHHH HHHHHHHHHH HHHHHHHHHH HHCCCC |
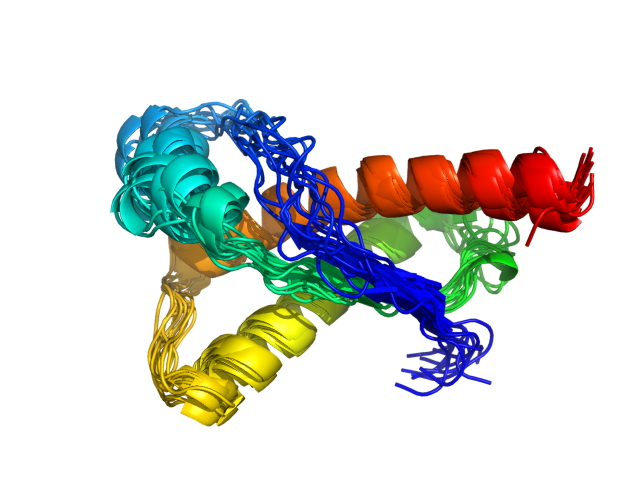
| Movie from predicted structures | To download the movie, right click on the desired file format:  
|
| Estimated finish time | 2018-Jul-11 17:29 UTC |
| Project Name |

| Project Name |
| Cluster # | 1 | 2 | 3 | 4 | 5 | 6 | 7 | 8 | 9 | 10 | 11 | 12 |
| Cluster density | 186.5 | 151.0 | 147.5 | 125.6 | 114.2 | 98.3 | 94.5 | 91.8 | 63.1 | 62.0 | 55.0 | 50.4 |
| Cluster size | 289 | 245 | 239 | 180 | 181 | 162 | 165 | 147 | 110 | 101 | 84 | 97 |
| Average cluster RMSD | 1.5 | 1.6 | 1.6 | 1.4 | 1.6 | 1.6 | 1.7 | 1.6 | 1.7 | 1.6 | 1.5 | 1.9 |
| # | 1 | 2 | 3 | 4 | 5 | 6 | 7 | 8 | 9 | 10 | 11 | 12 |
| RMSD | 2.62 | 2.39 | 2.36 | 3.02 | 2.30 | 2.75 | 2.42 | 2.85 | 2.65 | 2.71 | 2.12 | 3.23 |
| GDT_TS | 0.68 | 0.73 | 0.79 | 0.69 | 0.72 | 0.71 | 0.75 | 0.69 | 0.70 | 0.70 | 0.75 | 0.70 |
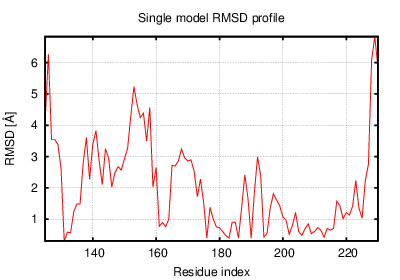
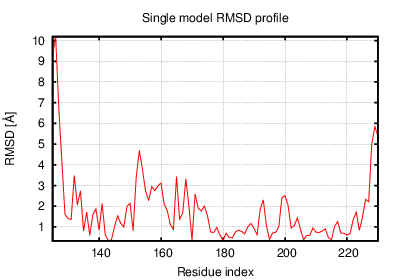
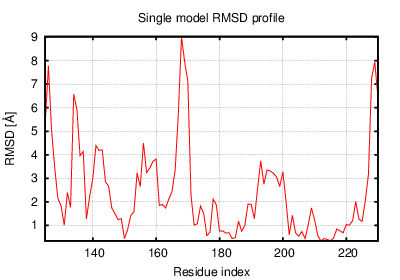
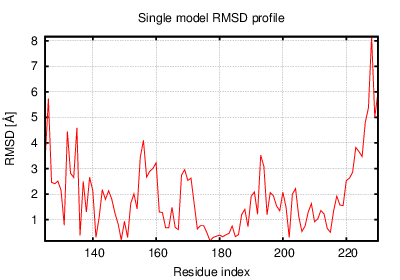
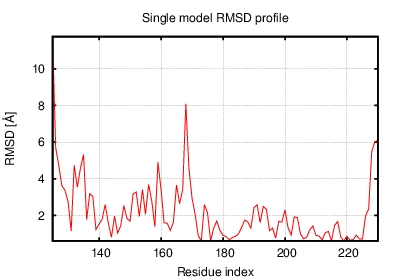
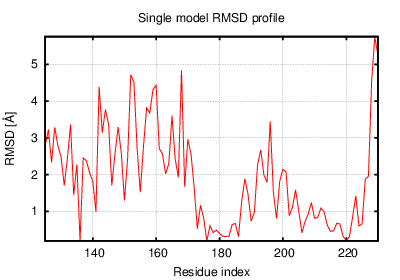
The table contains RMSD and GDT_TS values (calculated on the Cα atoms) between the predicted models and the input structure. Note that GDT_TS metric is intended as a more accurate measurement than the more common RMSD.
Read more about the root-mean-square deviation (RMSD) measure
Read more about the global distance test (GDT, also written as GDT_TS to represent "total score") measure.
| # | 1 | 2 | 3 | 4 | 5 | 6 | 7 | 8 | 9 | 10 | 11 | 12 |
| 1 | 0.00 | 2.15 | 1.93 | 3.10 | 2.06 | 2.59 | 2.11 | 2.74 | 1.82 | 2.72 | 2.38 | 2.81 |
| 2 | 2.15 | 0.00 | 1.75 | 2.73 | 1.88 | 2.31 | 1.91 | 2.32 | 1.91 | 2.66 | 2.18 | 2.70 |
| 3 | 1.93 | 1.75 | 0.00 | 2.62 | 1.90 | 2.22 | 1.58 | 2.29 | 1.83 | 2.15 | 1.87 | 2.55 |
| 4 | 3.10 | 2.73 | 2.62 | 0.00 | 2.78 | 2.07 | 2.14 | 1.69 | 2.92 | 2.26 | 2.99 | 2.50 |
| 5 | 2.06 | 1.88 | 1.90 | 2.78 | 0.00 | 2.50 | 1.63 | 2.35 | 1.79 | 2.47 | 1.89 | 2.69 |
| 6 | 2.59 | 2.31 | 2.22 | 2.07 | 2.50 | 0.00 | 2.10 | 1.94 | 2.54 | 2.22 | 2.72 | 2.33 |
| 7 | 2.11 | 1.91 | 1.58 | 2.14 | 1.63 | 2.10 | 0.00 | 1.83 | 1.75 | 2.04 | 1.92 | 2.24 |
| 8 | 2.74 | 2.32 | 2.29 | 1.69 | 2.35 | 1.94 | 1.83 | 0.00 | 2.60 | 1.91 | 2.66 | 2.23 |
| 9 | 1.82 | 1.91 | 1.83 | 2.92 | 1.79 | 2.54 | 1.75 | 2.60 | 0.00 | 2.65 | 2.17 | 2.52 |
| 10 | 2.72 | 2.66 | 2.15 | 2.26 | 2.47 | 2.22 | 2.04 | 1.91 | 2.65 | 0.00 | 2.53 | 2.49 |
| 11 | 2.38 | 2.18 | 1.87 | 2.99 | 1.89 | 2.72 | 1.92 | 2.66 | 2.17 | 2.53 | 0.00 | 3.17 |
| 12 | 2.81 | 2.70 | 2.55 | 2.50 | 2.69 | 2.33 | 2.24 | 2.23 | 2.52 | 2.49 | 3.17 | 0.00 |
The table contains RMSD values (calculated on the Cα atoms) between the predicted models.
Read more about the root-mean-square deviation (RMSD) measure.
| # | 1 | 2 | 3 | 4 | 5 | 6 | 7 | 8 | 9 | 10 | 11 | 12 |
| 1 | 1.00 | 0.73 | 0.76 | 0.65 | 0.76 | 0.69 | 0.74 | 0.73 | 0.78 | 0.70 | 0.75 | 0.72 |
| 2 | 0.73 | 1.00 | 0.81 | 0.73 | 0.78 | 0.76 | 0.78 | 0.79 | 0.78 | 0.74 | 0.79 | 0.75 |
| 3 | 0.76 | 0.81 | 1.00 | 0.71 | 0.78 | 0.74 | 0.81 | 0.75 | 0.80 | 0.79 | 0.84 | 0.74 |
| 4 | 0.65 | 0.73 | 0.71 | 1.00 | 0.74 | 0.79 | 0.79 | 0.80 | 0.70 | 0.75 | 0.70 | 0.76 |
| 5 | 0.76 | 0.78 | 0.78 | 0.74 | 1.00 | 0.73 | 0.84 | 0.77 | 0.82 | 0.74 | 0.79 | 0.79 |
| 6 | 0.69 | 0.76 | 0.74 | 0.79 | 0.73 | 1.00 | 0.77 | 0.76 | 0.73 | 0.73 | 0.75 | 0.79 |
| 7 | 0.74 | 0.78 | 0.81 | 0.79 | 0.84 | 0.77 | 1.00 | 0.82 | 0.82 | 0.75 | 0.79 | 0.80 |
| 8 | 0.73 | 0.79 | 0.75 | 0.80 | 0.77 | 0.76 | 0.82 | 1.00 | 0.73 | 0.78 | 0.73 | 0.79 |
| 9 | 0.78 | 0.78 | 0.80 | 0.70 | 0.82 | 0.73 | 0.82 | 0.73 | 1.00 | 0.70 | 0.78 | 0.77 |
| 10 | 0.70 | 0.74 | 0.79 | 0.75 | 0.74 | 0.73 | 0.75 | 0.78 | 0.70 | 1.00 | 0.74 | 0.72 |
| 11 | 0.75 | 0.79 | 0.84 | 0.70 | 0.79 | 0.75 | 0.79 | 0.73 | 0.78 | 0.74 | 1.00 | 0.73 |
| 12 | 0.72 | 0.75 | 0.74 | 0.76 | 0.79 | 0.79 | 0.80 | 0.79 | 0.77 | 0.72 | 0.73 | 1.00 |
The table contains GDT_TS values (calculated on the Cα atoms) between the predicted models.
Read more about the global distance test (GDT, also written as GDT_TS to represent "total score") measure.
© Laboratory of Theory of Biopolymers, Faculty of Chemistry, University of Warsaw 2013