Status: Done started: 2018-Apr-27 01:16:53 UTC
| Project Name | 7 |
| Sequence | IVGGYTCAAN SIPYQVSLNS GSHFCGGSLI NSQWVVSAAH CYKSRIQVRL GEHNIDVLEG NEQFINAAKI ITHPNFDIML IKLSSPATLN SRVATVSLPR SCAAAGTECL ISGWGNTKSS GSSYPSLLQC LKAPVLSDSS CKSSYPGQIT GNMICVGFLE GGKDSCQGDS GGPVVCNGQL QGIVSWGYGC AQKNKPGVYT KVCNYVNWIQ QTIAAN |
| Secondary structure | CCCCEECCCC CCCCEEEEEC CCEEEEEEEE ECCEEEEECC CCCCCCEEEE CCCCCCCCCC CCEEEEEEEE EECCCCCEEE EEECCCCCCC CCCCCCCCCC CCCCCCCEEE EEECCCCCCC CCCCCCCCEE EEEECCCHHH HHHHCCCCCC CCEEEECCCC CCCCCCCCCC CCEEEECCEE EEEEEECCCC CCCCCCEEEE ECCCCHHHHH HHHHCC |
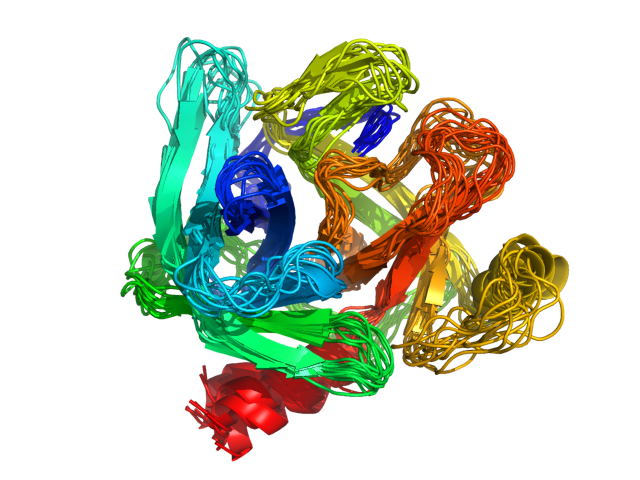
| Movie from predicted structures | To download the movie, right click on the desired file format:  
|
| Estimated finish time | 2018-Apr-27 06:04 UTC |
| Project Name | 7 |


| Project Name | 7 |
| Cluster # | 1 | 2 | 3 | 4 | 5 | 6 | 7 | 8 | 9 | 10 | 11 | 12 |
| Cluster density | 233.6 | 181.9 | 171.9 | 148.1 | 116.6 | 115.7 | 105.8 | 94.7 | 90.8 | 83.9 | 77.2 | 41.7 |
| Cluster size | 322 | 247 | 246 | 200 | 159 | 150 | 134 | 134 | 133 | 117 | 99 | 59 |
| Average cluster RMSD | 1.4 | 1.4 | 1.4 | 1.4 | 1.4 | 1.3 | 1.3 | 1.4 | 1.5 | 1.4 | 1.3 | 1.4 |
| # | 1 | 2 | 3 | 4 | 5 | 6 | 7 | 8 | 9 | 10 | 11 | 12 |
| RMSD | 2.58 | 3.31 | 2.55 | 2.52 | 2.46 | 2.73 | 3.00 | 2.49 | 3.09 | 2.68 | 2.79 | 2.41 |
| GDT_TS | 0.69 | 0.65 | 0.71 | 0.70 | 0.69 | 0.70 | 0.66 | 0.69 | 0.67 | 0.69 | 0.68 | 0.69 |
The table contains RMSD and GDT_TS values (calculated on the Cα atoms) between the predicted models and the input structure. Note that GDT_TS metric is intended as a more accurate measurement than the more common RMSD.
Read more about the root-mean-square deviation (RMSD) measure
Read more about the global distance test (GDT, also written as GDT_TS to represent "total score") measure.
| # | 1 | 2 | 3 | 4 | 5 | 6 | 7 | 8 | 9 | 10 | 11 | 12 |
| 1 | 0.00 | 2.76 | 2.47 | 2.01 | 2.24 | 2.45 | 2.63 | 2.29 | 2.56 | 2.41 | 2.52 | 1.90 |
| 2 | 2.76 | 0.00 | 2.53 | 2.66 | 2.91 | 2.47 | 2.52 | 2.86 | 2.24 | 2.34 | 2.12 | 2.80 |
| 3 | 2.47 | 2.53 | 0.00 | 2.25 | 2.40 | 2.03 | 2.52 | 2.46 | 2.17 | 2.31 | 2.36 | 2.26 |
| 4 | 2.01 | 2.66 | 2.25 | 0.00 | 1.86 | 2.36 | 2.40 | 1.88 | 2.48 | 2.15 | 2.43 | 1.95 |
| 5 | 2.24 | 2.91 | 2.40 | 1.86 | 0.00 | 2.61 | 2.40 | 1.68 | 2.68 | 1.99 | 2.44 | 1.87 |
| 6 | 2.45 | 2.47 | 2.03 | 2.36 | 2.61 | 0.00 | 2.27 | 2.64 | 2.00 | 2.46 | 2.43 | 2.41 |
| 7 | 2.63 | 2.52 | 2.52 | 2.40 | 2.40 | 2.27 | 0.00 | 2.54 | 2.29 | 2.05 | 2.51 | 2.46 |
| 8 | 2.29 | 2.86 | 2.46 | 1.88 | 1.68 | 2.64 | 2.54 | 0.00 | 2.71 | 2.05 | 2.33 | 2.00 |
| 9 | 2.56 | 2.24 | 2.17 | 2.48 | 2.68 | 2.00 | 2.29 | 2.71 | 0.00 | 2.40 | 2.41 | 2.48 |
| 10 | 2.41 | 2.34 | 2.31 | 2.15 | 1.99 | 2.46 | 2.05 | 2.05 | 2.40 | 0.00 | 2.10 | 1.88 |
| 11 | 2.52 | 2.12 | 2.36 | 2.43 | 2.44 | 2.43 | 2.51 | 2.33 | 2.41 | 2.10 | 0.00 | 2.27 |
| 12 | 1.90 | 2.80 | 2.26 | 1.95 | 1.87 | 2.41 | 2.46 | 2.00 | 2.48 | 1.88 | 2.27 | 0.00 |
The table contains RMSD values (calculated on the Cα atoms) between the predicted models.
Read more about the root-mean-square deviation (RMSD) measure.
| # | 1 | 2 | 3 | 4 | 5 | 6 | 7 | 8 | 9 | 10 | 11 | 12 |
| 1 | 1.00 | 0.67 | 0.71 | 0.77 | 0.73 | 0.70 | 0.66 | 0.71 | 0.70 | 0.70 | 0.70 | 0.78 |
| 2 | 0.67 | 1.00 | 0.73 | 0.70 | 0.68 | 0.71 | 0.72 | 0.68 | 0.78 | 0.75 | 0.76 | 0.68 |
| 3 | 0.71 | 0.73 | 1.00 | 0.73 | 0.71 | 0.77 | 0.70 | 0.68 | 0.76 | 0.74 | 0.72 | 0.71 |
| 4 | 0.77 | 0.70 | 0.73 | 1.00 | 0.79 | 0.70 | 0.69 | 0.78 | 0.71 | 0.75 | 0.70 | 0.77 |
| 5 | 0.73 | 0.68 | 0.71 | 0.79 | 1.00 | 0.70 | 0.69 | 0.80 | 0.69 | 0.74 | 0.70 | 0.77 |
| 6 | 0.70 | 0.71 | 0.77 | 0.70 | 0.70 | 1.00 | 0.72 | 0.68 | 0.77 | 0.73 | 0.73 | 0.71 |
| 7 | 0.66 | 0.72 | 0.70 | 0.69 | 0.69 | 0.72 | 1.00 | 0.68 | 0.74 | 0.75 | 0.70 | 0.69 |
| 8 | 0.71 | 0.68 | 0.68 | 0.78 | 0.80 | 0.68 | 0.68 | 1.00 | 0.67 | 0.74 | 0.69 | 0.74 |
| 9 | 0.70 | 0.78 | 0.76 | 0.71 | 0.69 | 0.77 | 0.74 | 0.67 | 1.00 | 0.74 | 0.73 | 0.72 |
| 10 | 0.70 | 0.75 | 0.74 | 0.75 | 0.74 | 0.73 | 0.75 | 0.74 | 0.74 | 1.00 | 0.76 | 0.78 |
| 11 | 0.70 | 0.76 | 0.72 | 0.70 | 0.70 | 0.73 | 0.70 | 0.69 | 0.73 | 0.76 | 1.00 | 0.72 |
| 12 | 0.78 | 0.68 | 0.71 | 0.77 | 0.77 | 0.71 | 0.69 | 0.74 | 0.72 | 0.78 | 0.72 | 1.00 |
The table contains GDT_TS values (calculated on the Cα atoms) between the predicted models.
Read more about the global distance test (GDT, also written as GDT_TS to represent "total score") measure.
© Laboratory of Theory of Biopolymers, Faculty of Chemistry, University of Warsaw 2013