Status: Done started: 2018-Apr-19 10:03:58 UTC
| Project Name | V3smyckaG |
| Sequence | MRLKKRIFAA VSEGCVEELR ELLQDLQDLC RRRRGLDVPD FLMHKLTASD TGKTCLMKAL LNINPNTKEI VRILLAFAEE NDILDRFINA EYTEEAYEGQ TALNIAIERR QGDITAVLIA AGADVNAGGG GGGGGGGGGG GGFYFGETPL ALAACTNQPE IVQLLMENEQ TDITSQDSRG NNILHALVTV AEDFKTQNDF VKRMYDMILL RSGNWELETM RNNDGLTPLQ LAAKMGKAEI LKYILSREI |
| Secondary structure | CCHHHHHHHH HHHCCHHHHH HHHHHHHHHC CCCCCCCHHH HHHHHCCCCC CCCCHHHHHH HCCCCCHHHH HHHHHHHHHH CCCHHHHHCC CCCCCCCCCC CHHHHHHHCC CHHHHHHHHH CCCCCCCCCC CCCCCCCCCC CCCCCCCCHH HHHHHCCCHH HHHHHHCCCC CCCCCCCCCC CCHHHHHHHH CCCCCCCCCH HHHHHHHHHH HHCCCCCCCC CCCCCCCHHH HHHHCCCHHH HHHHHHCCC |
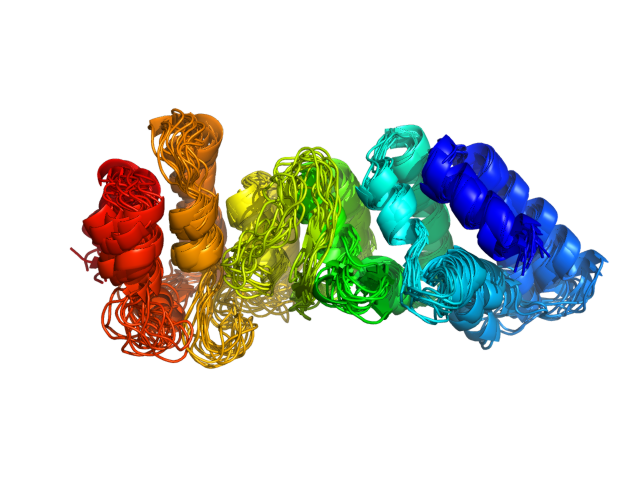
| Movie from predicted structures | To download the movie, right click on the desired file format:  
|
| Estimated finish time | 2018-Apr-19 14:55 UTC |
| Project Name | V3smyckaG |


| Project Name | V3smyckaG |
| Cluster # | 1 | 2 | 3 | 4 | 5 | 6 | 7 | 8 | 9 | 10 | 11 | 12 |
| Cluster density | 167.9 | 166.2 | 139.0 | 133.7 | 129.2 | 127.8 | 126.4 | 119.4 | 119.0 | 110.2 | 107.6 | 77.6 |
| Cluster size | 231 | 238 | 178 | 185 | 167 | 160 | 158 | 152 | 152 | 155 | 132 | 92 |
| Average cluster RMSD | 1.4 | 1.4 | 1.3 | 1.4 | 1.3 | 1.3 | 1.3 | 1.3 | 1.3 | 1.4 | 1.2 | 1.2 |
| # | 1 | 2 | 3 | 4 | 5 | 6 | 7 | 8 | 9 | 10 | 11 | 12 |
| RMSD | 3.36 | 2.99 | 3.50 | 3.11 | 3.32 | 3.29 | 3.24 | 3.22 | 3.83 | 3.05 | 3.35 | 3.31 |
| GDT_TS | 0.61 | 0.67 | 0.62 | 0.65 | 0.63 | 0.66 | 0.65 | 0.69 | 0.59 | 0.65 | 0.66 | 0.63 |
The table contains RMSD and GDT_TS values (calculated on the Cα atoms) between the predicted models and the input structure. Note that GDT_TS metric is intended as a more accurate measurement than the more common RMSD.
Read more about the root-mean-square deviation (RMSD) measure
Read more about the global distance test (GDT, also written as GDT_TS to represent "total score") measure.
| # | 1 | 2 | 3 | 4 | 5 | 6 | 7 | 8 | 9 | 10 | 11 | 12 |
| 1 | 0.00 | 2.68 | 2.38 | 2.37 | 2.69 | 2.60 | 2.21 | 2.28 | 2.33 | 1.95 | 2.25 | 2.30 |
| 2 | 2.68 | 0.00 | 2.42 | 2.37 | 2.72 | 2.52 | 2.97 | 2.59 | 2.87 | 2.25 | 2.93 | 3.18 |
| 3 | 2.38 | 2.42 | 0.00 | 2.82 | 2.76 | 2.47 | 2.69 | 2.64 | 2.46 | 2.06 | 2.86 | 2.99 |
| 4 | 2.37 | 2.37 | 2.82 | 0.00 | 2.28 | 2.36 | 2.72 | 2.06 | 2.44 | 2.16 | 2.67 | 2.50 |
| 5 | 2.69 | 2.72 | 2.76 | 2.28 | 0.00 | 2.15 | 3.27 | 2.17 | 2.70 | 2.40 | 3.15 | 3.15 |
| 6 | 2.60 | 2.52 | 2.47 | 2.36 | 2.15 | 0.00 | 3.12 | 2.15 | 2.73 | 2.25 | 3.16 | 3.21 |
| 7 | 2.21 | 2.97 | 2.69 | 2.72 | 3.27 | 3.12 | 0.00 | 2.86 | 2.72 | 2.31 | 1.79 | 2.01 |
| 8 | 2.28 | 2.59 | 2.64 | 2.06 | 2.17 | 2.15 | 2.86 | 0.00 | 2.18 | 2.12 | 2.66 | 2.77 |
| 9 | 2.33 | 2.87 | 2.46 | 2.44 | 2.70 | 2.73 | 2.72 | 2.18 | 0.00 | 2.17 | 2.56 | 2.64 |
| 10 | 1.95 | 2.25 | 2.06 | 2.16 | 2.40 | 2.25 | 2.31 | 2.12 | 2.17 | 0.00 | 2.44 | 2.46 |
| 11 | 2.25 | 2.93 | 2.86 | 2.67 | 3.15 | 3.16 | 1.79 | 2.66 | 2.56 | 2.44 | 0.00 | 1.91 |
| 12 | 2.30 | 3.18 | 2.99 | 2.50 | 3.15 | 3.21 | 2.01 | 2.77 | 2.64 | 2.46 | 1.91 | 0.00 |
The table contains RMSD values (calculated on the Cα atoms) between the predicted models.
Read more about the root-mean-square deviation (RMSD) measure.
| # | 1 | 2 | 3 | 4 | 5 | 6 | 7 | 8 | 9 | 10 | 11 | 12 |
| 1 | 1.00 | 0.65 | 0.70 | 0.69 | 0.64 | 0.65 | 0.70 | 0.70 | 0.70 | 0.74 | 0.71 | 0.70 |
| 2 | 0.65 | 1.00 | 0.70 | 0.68 | 0.65 | 0.68 | 0.63 | 0.71 | 0.65 | 0.73 | 0.65 | 0.60 |
| 3 | 0.70 | 0.70 | 1.00 | 0.66 | 0.65 | 0.69 | 0.68 | 0.70 | 0.68 | 0.74 | 0.65 | 0.62 |
| 4 | 0.69 | 0.68 | 0.66 | 1.00 | 0.69 | 0.70 | 0.67 | 0.74 | 0.70 | 0.71 | 0.71 | 0.71 |
| 5 | 0.64 | 0.65 | 0.65 | 0.69 | 1.00 | 0.73 | 0.61 | 0.72 | 0.65 | 0.69 | 0.66 | 0.63 |
| 6 | 0.65 | 0.68 | 0.69 | 0.70 | 0.73 | 1.00 | 0.66 | 0.77 | 0.68 | 0.71 | 0.66 | 0.62 |
| 7 | 0.70 | 0.63 | 0.68 | 0.67 | 0.61 | 0.66 | 1.00 | 0.68 | 0.67 | 0.72 | 0.79 | 0.73 |
| 8 | 0.70 | 0.71 | 0.70 | 0.74 | 0.72 | 0.77 | 0.68 | 1.00 | 0.70 | 0.73 | 0.70 | 0.66 |
| 9 | 0.70 | 0.65 | 0.68 | 0.70 | 0.65 | 0.68 | 0.67 | 0.70 | 1.00 | 0.73 | 0.69 | 0.70 |
| 10 | 0.74 | 0.73 | 0.74 | 0.71 | 0.69 | 0.71 | 0.72 | 0.73 | 0.73 | 1.00 | 0.69 | 0.69 |
| 11 | 0.71 | 0.65 | 0.65 | 0.71 | 0.66 | 0.66 | 0.79 | 0.70 | 0.69 | 0.69 | 1.00 | 0.76 |
| 12 | 0.70 | 0.60 | 0.62 | 0.71 | 0.63 | 0.62 | 0.73 | 0.66 | 0.70 | 0.69 | 0.76 | 1.00 |
The table contains GDT_TS values (calculated on the Cα atoms) between the predicted models.
Read more about the global distance test (GDT, also written as GDT_TS to represent "total score") measure.
© Laboratory of Theory of Biopolymers, Faculty of Chemistry, University of Warsaw 2013