Status: Done started: 2018-Jun-19 08:02:46 UTC
| Project Name | |
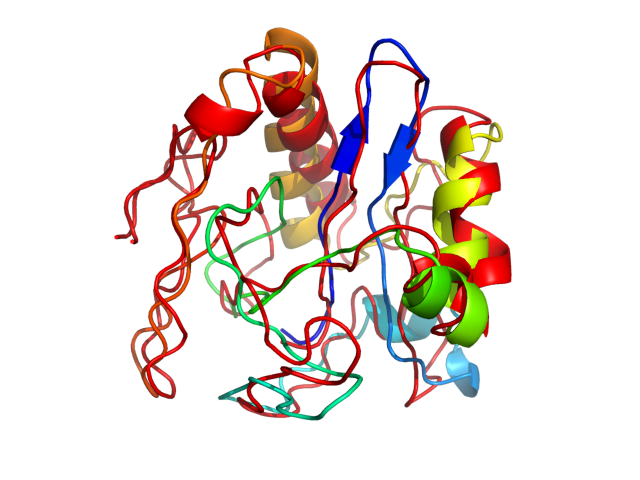
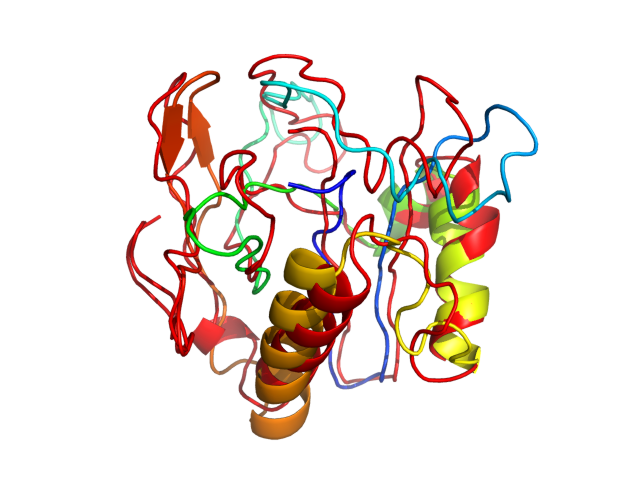
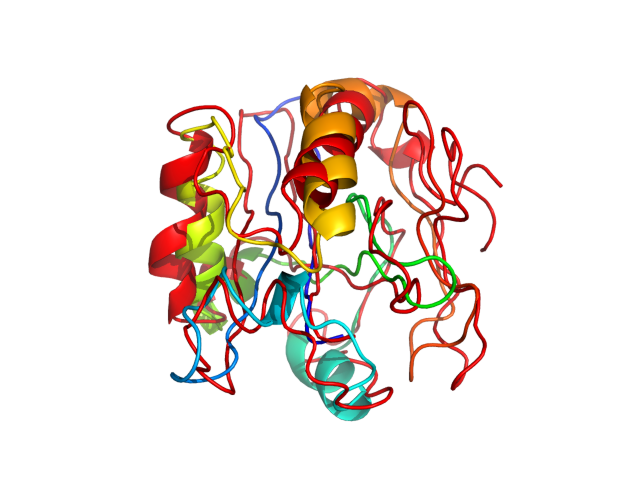
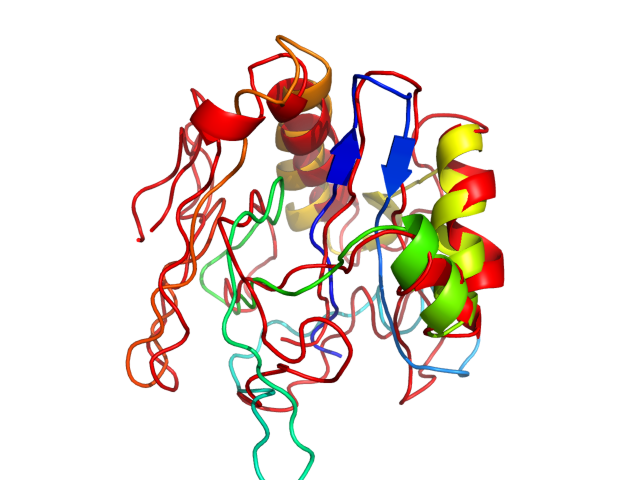
| Sequence | MAARLCCQLD PARDVLCLRP VGAESRGRPL PGPLGAIPPA SPSTVPTDHG AHLSLRGLPV CAFSSAGPCA LRFTSARRME TTVNAHRNLP KVLHKRTLGL SVMSTTDLEA YFKDCVFTEW EELGEEMRLK VFVLGGCRHK LVCSPAPCNF FTSA |
| Secondary structure | CCCCCCCCCC CCCCCCCCCC CCCCCCCCCC CCCCCCCCCC CCCCCCCCCC CCCCCCCCCC CCCCCCCCCC CCCCCCCHHH HHCCCCCCHH HHHCCCCCCC CCCCCHHHHH HHHHHHHHHC CCCCCCCCCC CCCCCCCCCC CCCCCCCCCC CCCC |
| Movie from predicted structures | To download the movie, right click on the desired file format:  
|
| Estimated finish time | 2018-Jun-19 12:42 UTC |
| Project Name |

| Project Name |
| Cluster # | 1 | 2 | 3 | 4 | 5 | 6 | 7 | 8 | 9 | 10 | 11 | 12 |
| Cluster density | 177.7 | 153.7 | 147.9 | 137.4 | 123.3 | 120.4 | 86.8 | 86.1 | 76.4 | 59.9 | 51.2 | 36.1 |
| Cluster size | 273 | 243 | 246 | 204 | 211 | 189 | 135 | 145 | 121 | 113 | 66 | 54 |
| Average cluster RMSD | 1.5 | 1.6 | 1.7 | 1.5 | 1.7 | 1.6 | 1.6 | 1.7 | 1.6 | 1.9 | 1.3 | 1.5 |
| # | 1 | 2 | 3 | 4 | 5 | 6 | 7 | 8 | 9 | 10 | 11 | 12 |
| RMSD | 2.99 | 3.54 | 3.08 | 3.18 | 3.27 | 3.11 | 3.34 | 3.11 | 3.37 | 3.17 | 3.42 | 3.72 |
| GDT_TS | 0.57 | 0.54 | 0.57 | 0.59 | 0.58 | 0.60 | 0.61 | 0.57 | 0.56 | 0.60 | 0.57 | 0.54 |
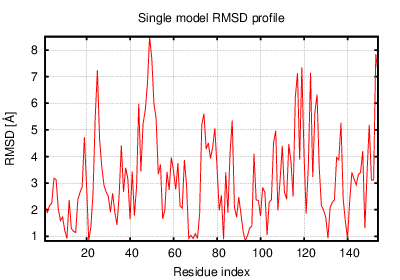
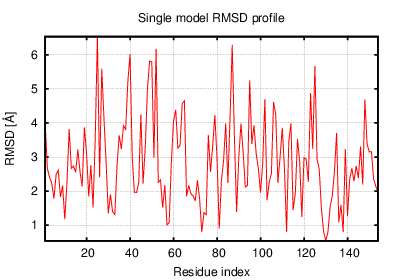
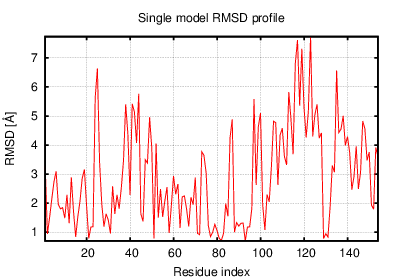
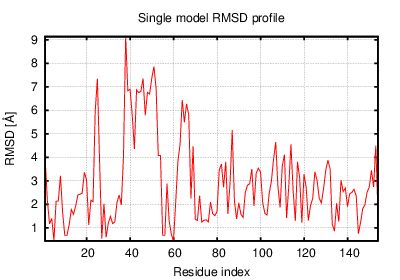
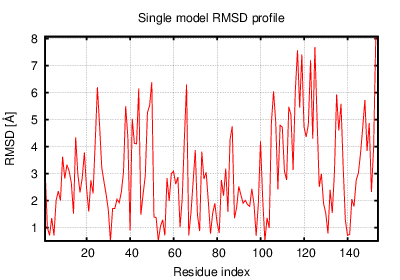
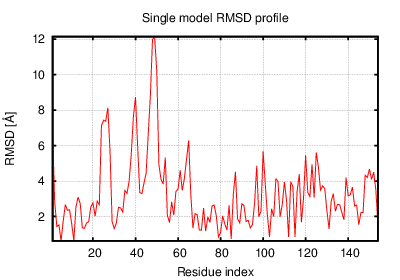
The table contains RMSD and GDT_TS values (calculated on the Cα atoms) between the predicted models and the input structure. Note that GDT_TS metric is intended as a more accurate measurement than the more common RMSD.
Read more about the root-mean-square deviation (RMSD) measure
Read more about the global distance test (GDT, also written as GDT_TS to represent "total score") measure.
| # | 1 | 2 | 3 | 4 | 5 | 6 | 7 | 8 | 9 | 10 | 11 | 12 |
| 1 | 0.00 | 3.12 | 3.54 | 2.87 | 3.86 | 2.87 | 3.95 | 3.47 | 3.97 | 3.42 | 3.10 | 3.91 |
| 2 | 3.12 | 0.00 | 3.44 | 2.81 | 3.75 | 2.95 | 3.53 | 3.44 | 3.69 | 3.70 | 2.45 | 3.66 |
| 3 | 3.54 | 3.44 | 0.00 | 3.45 | 3.27 | 3.28 | 2.95 | 2.16 | 2.78 | 3.10 | 3.24 | 2.72 |
| 4 | 2.87 | 2.81 | 3.45 | 0.00 | 3.89 | 3.10 | 3.66 | 3.55 | 3.78 | 3.66 | 2.27 | 3.75 |
| 5 | 3.86 | 3.75 | 3.27 | 3.89 | 0.00 | 3.29 | 2.52 | 3.06 | 2.78 | 2.93 | 3.68 | 3.20 |
| 6 | 2.87 | 2.95 | 3.28 | 3.10 | 3.29 | 0.00 | 3.18 | 3.06 | 3.25 | 3.30 | 3.18 | 3.05 |
| 7 | 3.95 | 3.53 | 2.95 | 3.66 | 2.52 | 3.18 | 0.00 | 2.48 | 2.64 | 3.14 | 3.47 | 2.78 |
| 8 | 3.47 | 3.44 | 2.16 | 3.55 | 3.06 | 3.06 | 2.48 | 0.00 | 2.49 | 2.90 | 3.42 | 2.57 |
| 9 | 3.97 | 3.69 | 2.78 | 3.78 | 2.78 | 3.25 | 2.64 | 2.49 | 0.00 | 3.34 | 3.61 | 2.48 |
| 10 | 3.42 | 3.70 | 3.10 | 3.66 | 2.93 | 3.30 | 3.14 | 2.90 | 3.34 | 0.00 | 3.56 | 3.01 |
| 11 | 3.10 | 2.45 | 3.24 | 2.27 | 3.68 | 3.18 | 3.47 | 3.42 | 3.61 | 3.56 | 0.00 | 3.57 |
| 12 | 3.91 | 3.66 | 2.72 | 3.75 | 3.20 | 3.05 | 2.78 | 2.57 | 2.48 | 3.01 | 3.57 | 0.00 |
The table contains RMSD values (calculated on the Cα atoms) between the predicted models.
Read more about the root-mean-square deviation (RMSD) measure.
| # | 1 | 2 | 3 | 4 | 5 | 6 | 7 | 8 | 9 | 10 | 11 | 12 |
| 1 | 1.00 | 0.65 | 0.55 | 0.63 | 0.54 | 0.66 | 0.57 | 0.57 | 0.53 | 0.56 | 0.63 | 0.55 |
| 2 | 0.65 | 1.00 | 0.58 | 0.65 | 0.54 | 0.62 | 0.57 | 0.57 | 0.58 | 0.53 | 0.69 | 0.56 |
| 3 | 0.55 | 0.58 | 1.00 | 0.55 | 0.58 | 0.59 | 0.66 | 0.73 | 0.69 | 0.63 | 0.58 | 0.70 |
| 4 | 0.63 | 0.65 | 0.55 | 1.00 | 0.53 | 0.61 | 0.56 | 0.56 | 0.55 | 0.56 | 0.74 | 0.55 |
| 5 | 0.54 | 0.54 | 0.58 | 0.53 | 1.00 | 0.57 | 0.70 | 0.61 | 0.64 | 0.68 | 0.54 | 0.63 |
| 6 | 0.66 | 0.62 | 0.59 | 0.61 | 0.57 | 1.00 | 0.63 | 0.61 | 0.60 | 0.59 | 0.62 | 0.63 |
| 7 | 0.57 | 0.57 | 0.66 | 0.56 | 0.70 | 0.63 | 1.00 | 0.69 | 0.68 | 0.70 | 0.58 | 0.68 |
| 8 | 0.57 | 0.57 | 0.73 | 0.56 | 0.61 | 0.61 | 0.69 | 1.00 | 0.72 | 0.65 | 0.59 | 0.69 |
| 9 | 0.53 | 0.58 | 0.69 | 0.55 | 0.64 | 0.60 | 0.68 | 0.72 | 1.00 | 0.60 | 0.58 | 0.72 |
| 10 | 0.56 | 0.53 | 0.63 | 0.56 | 0.68 | 0.59 | 0.70 | 0.65 | 0.60 | 1.00 | 0.57 | 0.65 |
| 11 | 0.63 | 0.69 | 0.58 | 0.74 | 0.54 | 0.62 | 0.58 | 0.59 | 0.58 | 0.57 | 1.00 | 0.58 |
| 12 | 0.55 | 0.56 | 0.70 | 0.55 | 0.63 | 0.63 | 0.68 | 0.69 | 0.72 | 0.65 | 0.58 | 1.00 |
The table contains GDT_TS values (calculated on the Cα atoms) between the predicted models.
Read more about the global distance test (GDT, also written as GDT_TS to represent "total score") measure.
© Laboratory of Theory of Biopolymers, Faculty of Chemistry, University of Warsaw 2013