Status: Done started: 2018-Apr-26 12:52:45 UTC
| Project Name | luxsali |
| Sequence | MPLLDSFTVD HTRMAAPAVR VAKTMQTPNK DTITVFDLRF CVPNQEILSE RGIHTLEHLF AGFMRDHLNG NGVEIIDISP MGCRTGFYMS LIGAPDEARV GAAWQAAMSD VLTVQEQGKI PELNEYQCGT YSMHSLEEAH AIARHVLERG IGVNRNDELA LPEEKLKSL |
| Secondary structure | CCCCCCCCCC CCCCCCCEEE EECCCCCCCC CCEEEEEEEC CCCCCCCCCC CHHHHHHHHH HHHHHHHHCC CCCEEECCCC CCCCCCEEEE EECCCCHHHH HHHHHHHHHH HHHCCCCCCC CCCCCCCCCC CCCCCHHHHH HHHHHHHHHC CEECCHHHHC CCHHHHHCC |
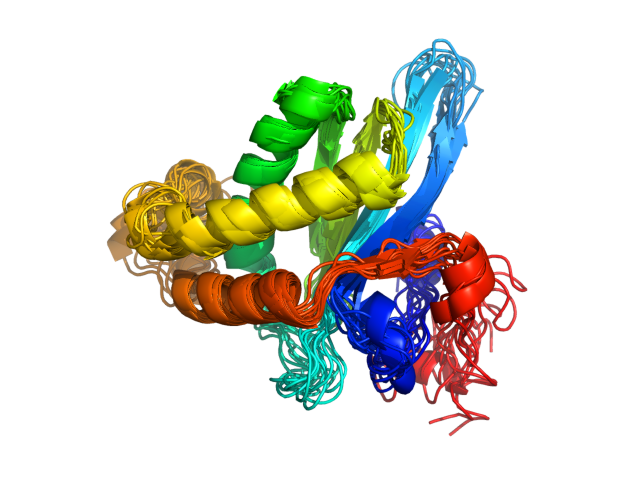
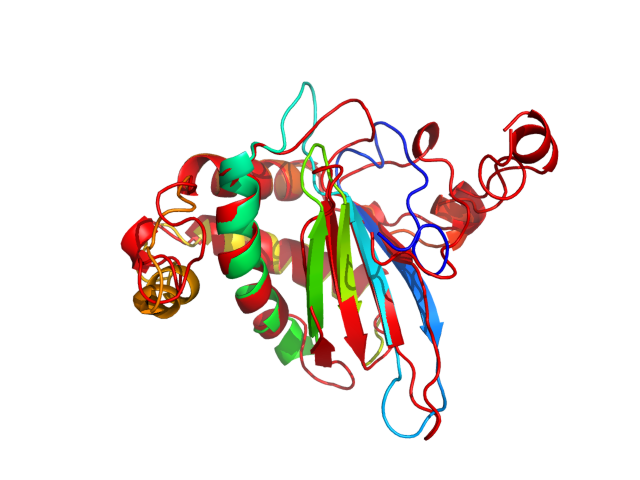
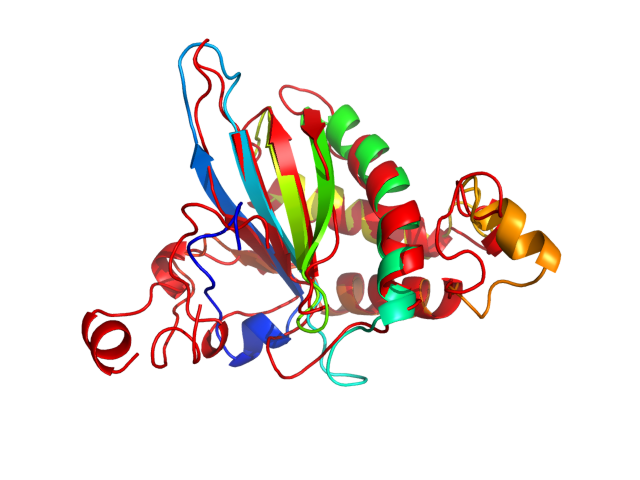
| Movie from predicted structures | To download the movie, right click on the desired file format:  
|
| Estimated finish time | 2018-Apr-26 17:33 UTC |
| Project Name | luxsali |


| Project Name | luxsali |
| Cluster # | 1 | 2 | 3 | 4 | 5 | 6 | 7 | 8 | 9 | 10 | 11 | 12 |
| Cluster density | 207.0 | 203.9 | 166.8 | 131.4 | 115.2 | 113.7 | 99.9 | 91.5 | 88.3 | 82.4 | 81.6 | 70.0 |
| Cluster size | 274 | 274 | 242 | 189 | 170 | 149 | 139 | 100 | 142 | 110 | 104 | 107 |
| Average cluster RMSD | 1.3 | 1.3 | 1.5 | 1.4 | 1.5 | 1.3 | 1.4 | 1.1 | 1.6 | 1.3 | 1.3 | 1.5 |
| # | 1 | 2 | 3 | 4 | 5 | 6 | 7 | 8 | 9 | 10 | 11 | 12 |
| RMSD | 3.51 | 3.57 | 3.57 | 3.77 | 3.44 | 3.93 | 3.49 | 3.81 | 3.15 | 3.75 | 3.47 | 3.31 |
| GDT_TS | 0.70 | 0.68 | 0.69 | 0.65 | 0.66 | 0.68 | 0.68 | 0.68 | 0.68 | 0.69 | 0.69 | 0.69 |
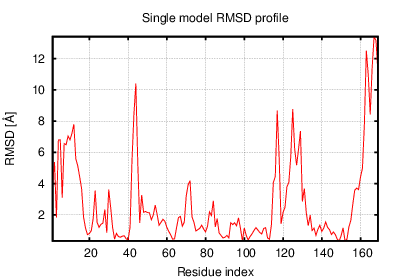
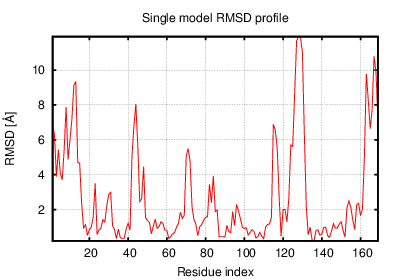
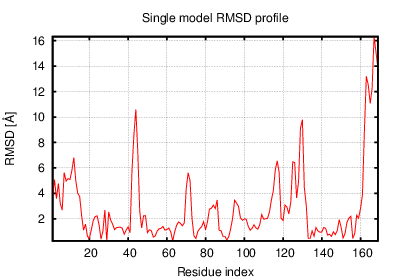
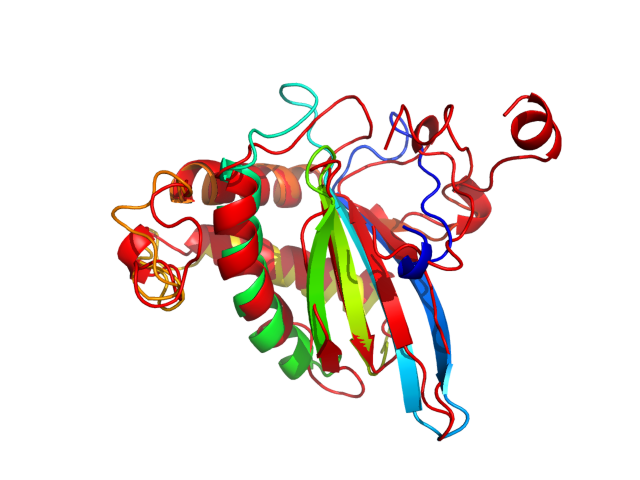
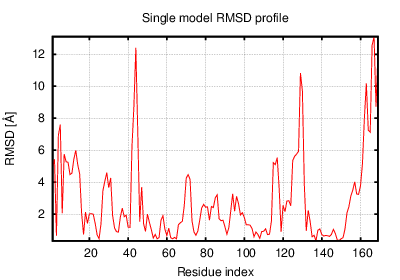
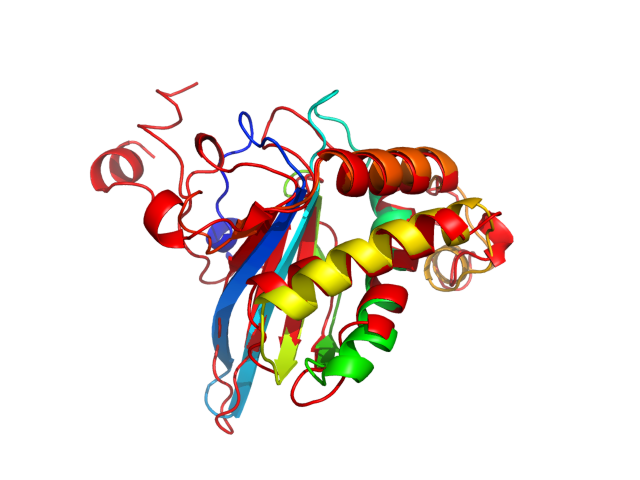
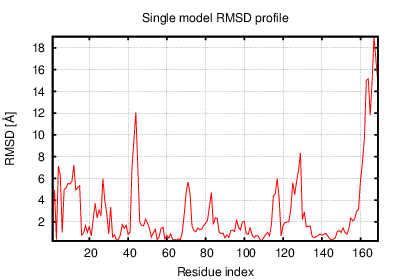
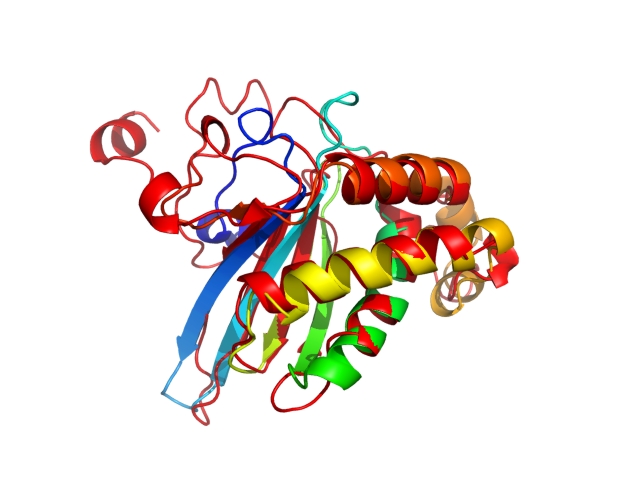
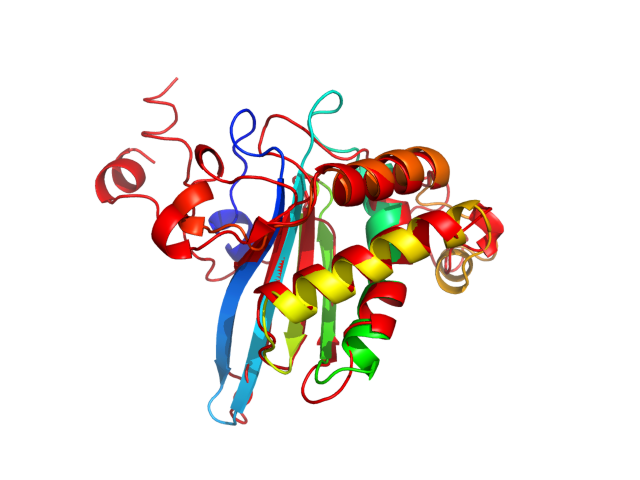
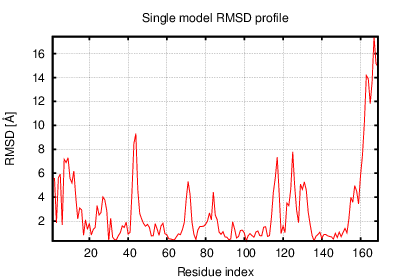
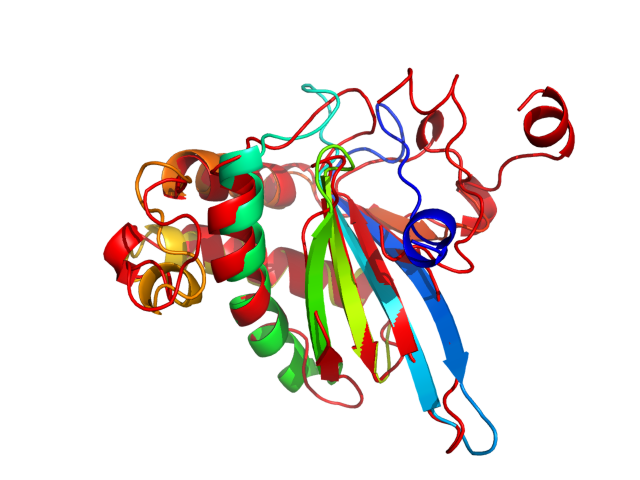
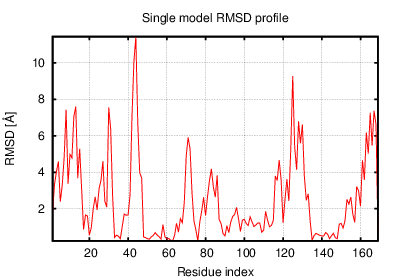
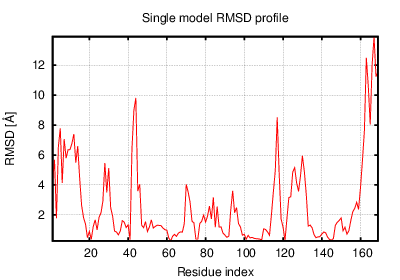
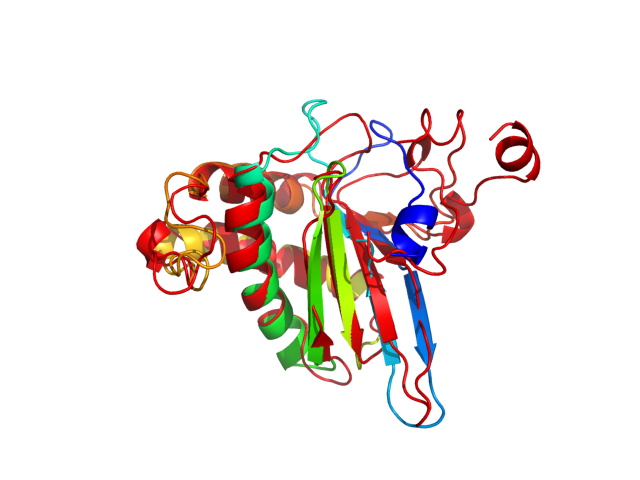
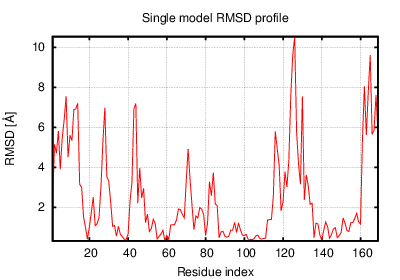
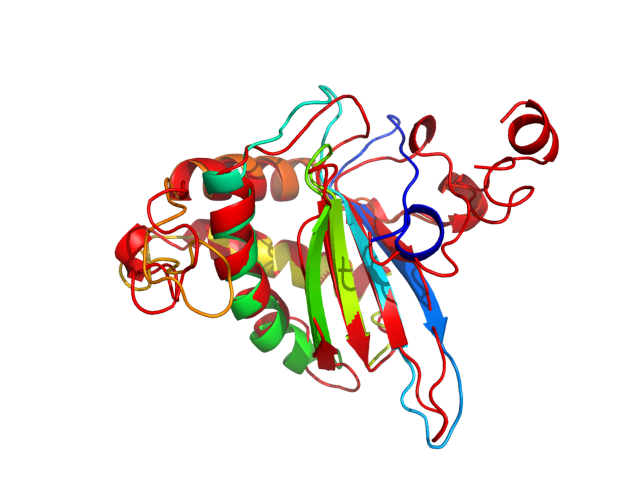
The table contains RMSD and GDT_TS values (calculated on the Cα atoms) between the predicted models and the input structure. Note that GDT_TS metric is intended as a more accurate measurement than the more common RMSD.
Read more about the root-mean-square deviation (RMSD) measure
Read more about the global distance test (GDT, also written as GDT_TS to represent "total score") measure.
| # | 1 | 2 | 3 | 4 | 5 | 6 | 7 | 8 | 9 | 10 | 11 | 12 |
| 1 | 0.00 | 1.76 | 2.65 | 2.00 | 2.65 | 2.07 | 2.49 | 2.33 | 3.32 | 2.31 | 1.88 | 3.82 |
| 2 | 1.76 | 0.00 | 2.76 | 2.17 | 2.94 | 2.22 | 2.83 | 2.16 | 3.24 | 2.84 | 1.87 | 3.67 |
| 3 | 2.65 | 2.76 | 0.00 | 2.62 | 3.39 | 3.25 | 3.26 | 3.29 | 2.71 | 2.16 | 3.17 | 3.50 |
| 4 | 2.00 | 2.17 | 2.62 | 0.00 | 3.14 | 2.30 | 3.14 | 2.32 | 3.31 | 2.37 | 2.29 | 3.73 |
| 5 | 2.65 | 2.94 | 3.39 | 3.14 | 0.00 | 2.67 | 1.97 | 2.79 | 3.25 | 3.25 | 2.74 | 3.96 |
| 6 | 2.07 | 2.22 | 3.25 | 2.30 | 2.67 | 0.00 | 2.94 | 1.73 | 3.72 | 3.03 | 2.28 | 4.26 |
| 7 | 2.49 | 2.83 | 3.26 | 3.14 | 1.97 | 2.94 | 0.00 | 3.00 | 3.28 | 3.23 | 2.68 | 3.91 |
| 8 | 2.33 | 2.16 | 3.29 | 2.32 | 2.79 | 1.73 | 3.00 | 0.00 | 3.64 | 3.26 | 2.00 | 3.89 |
| 9 | 3.32 | 3.24 | 2.71 | 3.31 | 3.25 | 3.72 | 3.28 | 3.64 | 0.00 | 3.25 | 3.31 | 2.75 |
| 10 | 2.31 | 2.84 | 2.16 | 2.37 | 3.25 | 3.03 | 3.23 | 3.26 | 3.25 | 0.00 | 2.93 | 4.01 |
| 11 | 1.88 | 1.87 | 3.17 | 2.29 | 2.74 | 2.28 | 2.68 | 2.00 | 3.31 | 2.93 | 0.00 | 3.44 |
| 12 | 3.82 | 3.67 | 3.50 | 3.73 | 3.96 | 4.26 | 3.91 | 3.89 | 2.75 | 4.01 | 3.44 | 0.00 |
The table contains RMSD values (calculated on the Cα atoms) between the predicted models.
Read more about the root-mean-square deviation (RMSD) measure.
| # | 1 | 2 | 3 | 4 | 5 | 6 | 7 | 8 | 9 | 10 | 11 | 12 |
| 1 | 1.00 | 0.80 | 0.76 | 0.78 | 0.73 | 0.76 | 0.80 | 0.77 | 0.71 | 0.77 | 0.82 | 0.71 |
| 2 | 0.80 | 1.00 | 0.72 | 0.73 | 0.72 | 0.75 | 0.77 | 0.77 | 0.67 | 0.71 | 0.81 | 0.68 |
| 3 | 0.76 | 0.72 | 1.00 | 0.76 | 0.70 | 0.71 | 0.71 | 0.69 | 0.75 | 0.78 | 0.71 | 0.74 |
| 4 | 0.78 | 0.73 | 0.76 | 1.00 | 0.70 | 0.71 | 0.74 | 0.73 | 0.72 | 0.78 | 0.73 | 0.68 |
| 5 | 0.73 | 0.72 | 0.70 | 0.70 | 1.00 | 0.79 | 0.78 | 0.75 | 0.70 | 0.71 | 0.72 | 0.66 |
| 6 | 0.76 | 0.75 | 0.71 | 0.71 | 0.79 | 1.00 | 0.77 | 0.82 | 0.70 | 0.70 | 0.76 | 0.66 |
| 7 | 0.80 | 0.77 | 0.71 | 0.74 | 0.78 | 0.77 | 1.00 | 0.76 | 0.72 | 0.71 | 0.77 | 0.68 |
| 8 | 0.77 | 0.77 | 0.69 | 0.73 | 0.75 | 0.82 | 0.76 | 1.00 | 0.69 | 0.70 | 0.77 | 0.68 |
| 9 | 0.71 | 0.67 | 0.75 | 0.72 | 0.70 | 0.70 | 0.72 | 0.69 | 1.00 | 0.71 | 0.69 | 0.71 |
| 10 | 0.77 | 0.71 | 0.78 | 0.78 | 0.71 | 0.70 | 0.71 | 0.70 | 0.71 | 1.00 | 0.71 | 0.69 |
| 11 | 0.82 | 0.81 | 0.71 | 0.73 | 0.72 | 0.76 | 0.77 | 0.77 | 0.69 | 0.71 | 1.00 | 0.69 |
| 12 | 0.71 | 0.68 | 0.74 | 0.68 | 0.66 | 0.66 | 0.68 | 0.68 | 0.71 | 0.69 | 0.69 | 1.00 |
The table contains GDT_TS values (calculated on the Cα atoms) between the predicted models.
Read more about the global distance test (GDT, also written as GDT_TS to represent "total score") measure.
© Laboratory of Theory of Biopolymers, Faculty of Chemistry, University of Warsaw 2013