Status: Done started: 2018-Jul-10 12:46:51 UTC
| Project Name | |
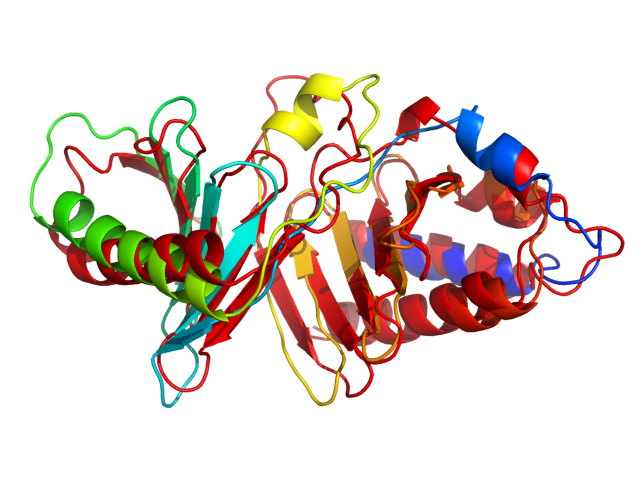
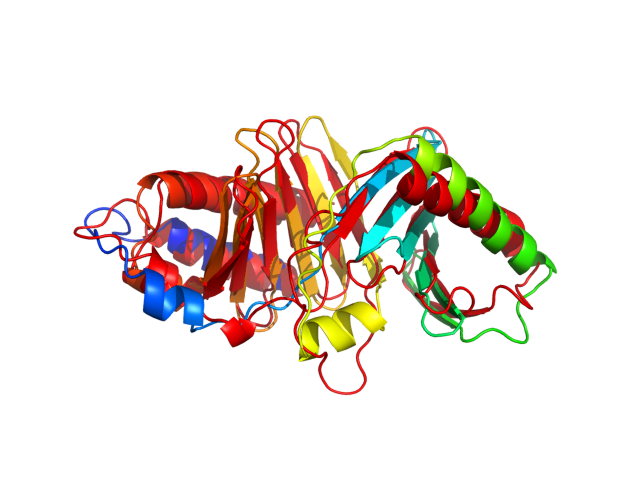
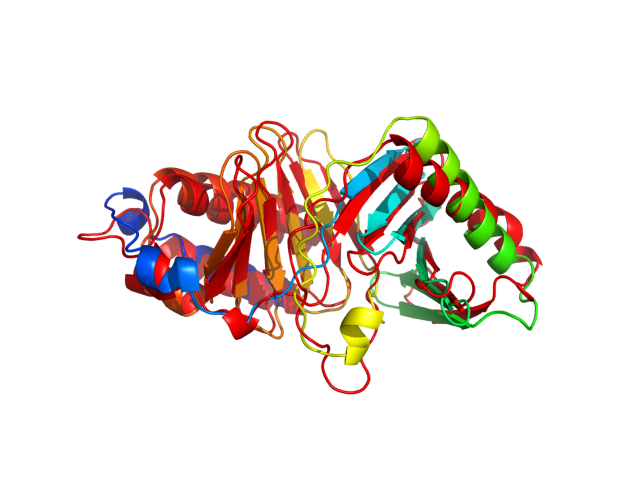
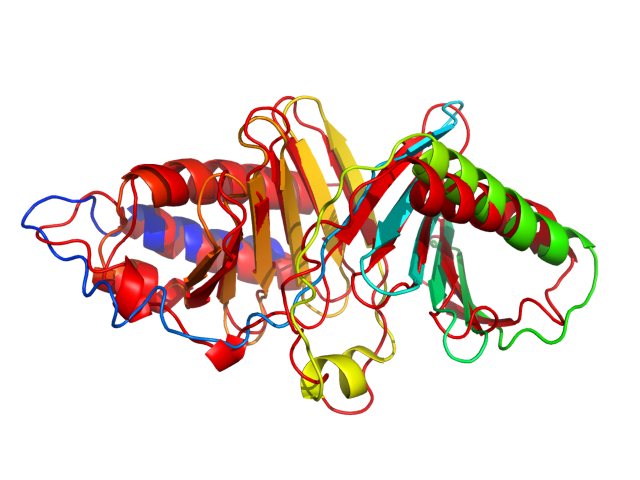
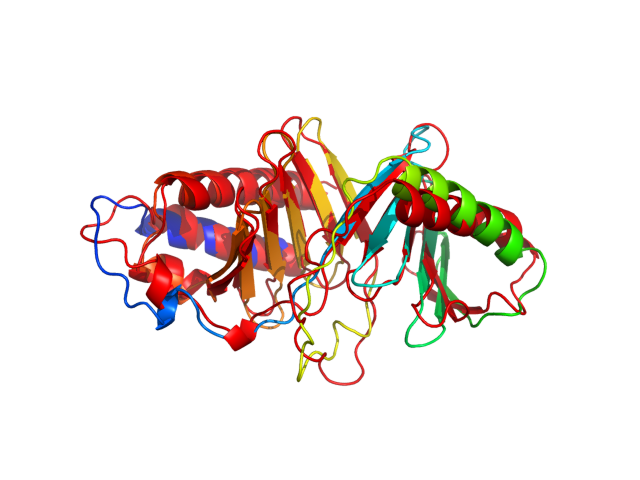
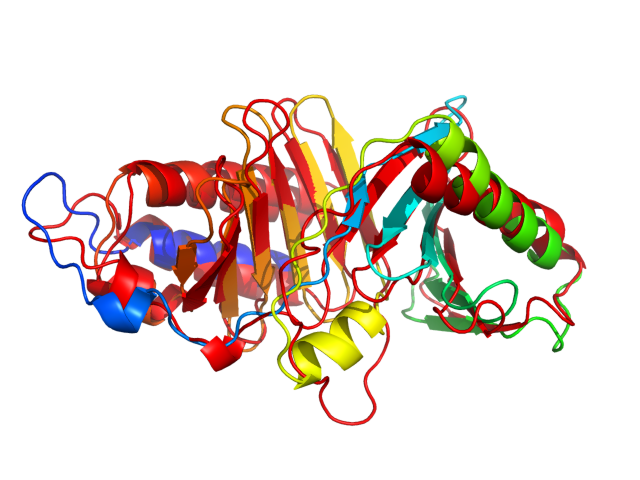
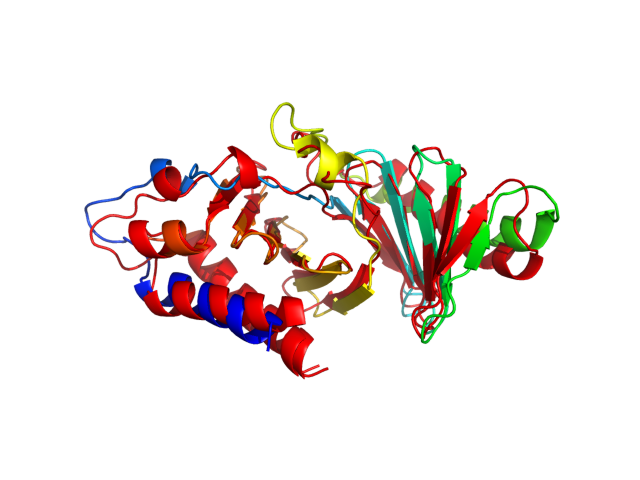
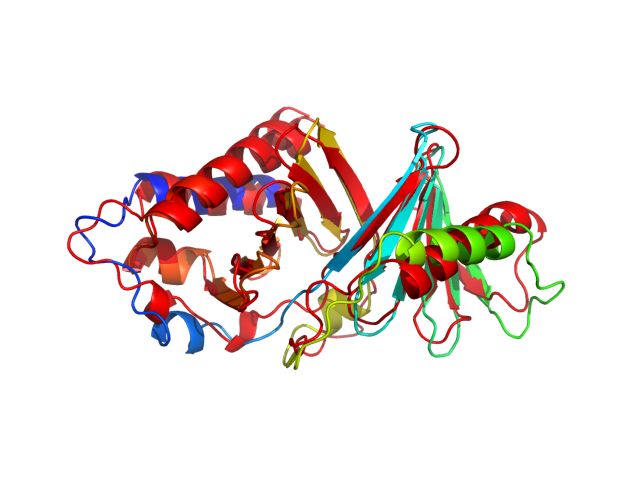
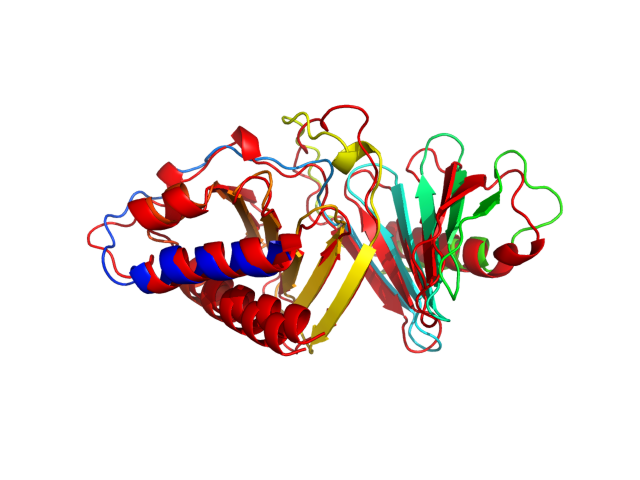
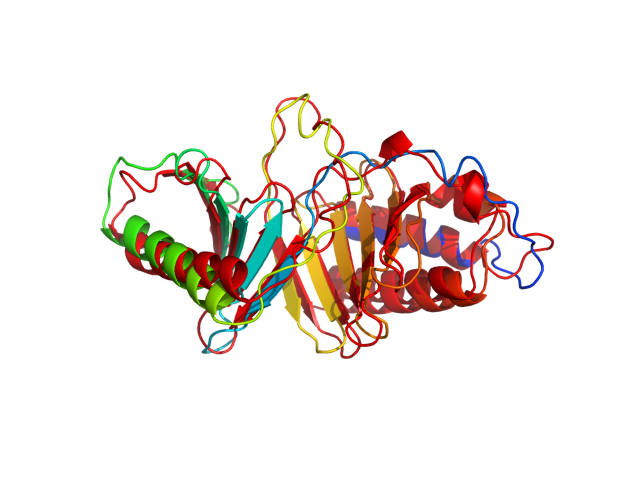
| Sequence | CHLSDMLQQL HSVNASKPSE RGLVRQEEAE DPACIPIFWV SKWVDYSDKY GLGYQLCDNS VGVLFNDSTR LILYNDGDSL QYIERDGTES YLTVSSHPNS LMKKITLLKY FRNYMSEHLL KAGANITPRE GDELARLPYL RTWFRTRSAI ILHLSNGSVQ INFFQDHTKL ILCPLMAAVT YIDEKRDFRT YRLSLLEEYG CCKELASRLR YARTMVDKLL SS |
| Secondary structure | CHHHHHHHHH HHHHHCCCCC CCCCCCCCCC CCCCCCCCCE EEEEEECCCC EEEEEECCCC EEEEECCCCE EEECCCCCEE EEECCCCCEE EEECCCCCCC CHHHHHHHHH HHHHHHHHCC CCCCCCCCCC CCCCCCCCCE EEEEECCCEE EEEECCCCEE EEECCCCCEE EEECCCCEEE EECCCCCEEE EEHHHHHHHC CCHHHHHHHH HHHHHHHHHH HC |
| Movie from predicted structures | To download the movie, right click on the desired file format:  
|
| Estimated finish time | 2018-Jul-10 17:35 UTC |
| Project Name |

| Project Name |
| Cluster # | 1 | 2 | 3 | 4 | 5 | 6 | 7 | 8 | 9 | 10 | 11 | 12 |
| Cluster density | 165.4 | 161.5 | 156.0 | 146.7 | 135.6 | 131.5 | 103.2 | 89.3 | 85.6 | 85.3 | 77.9 | 39.4 |
| Cluster size | 246 | 245 | 227 | 204 | 205 | 197 | 145 | 113 | 122 | 122 | 123 | 51 |
| Average cluster RMSD | 1.5 | 1.5 | 1.5 | 1.4 | 1.5 | 1.5 | 1.4 | 1.3 | 1.4 | 1.4 | 1.6 | 1.3 |
| # | 1 | 2 | 3 | 4 | 5 | 6 | 7 | 8 | 9 | 10 | 11 | 12 |
| RMSD | 2.58 | 2.95 | 2.98 | 2.82 | 3.04 | 2.58 | 2.78 | 2.94 | 2.92 | 3.11 | 2.73 | 2.57 |
| GDT_TS | 0.69 | 0.63 | 0.61 | 0.63 | 0.61 | 0.66 | 0.65 | 0.63 | 0.66 | 0.64 | 0.67 | 0.66 |
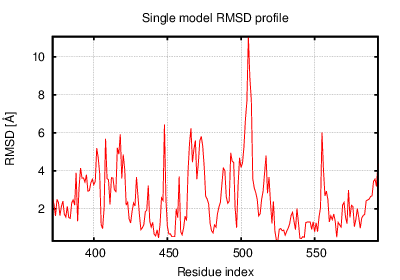
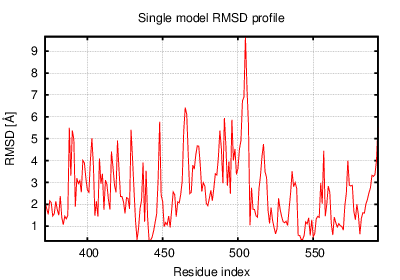
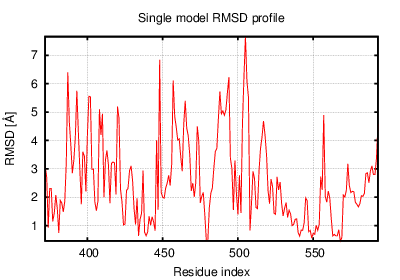
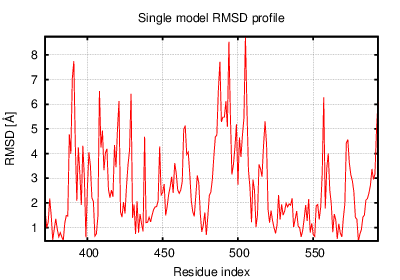
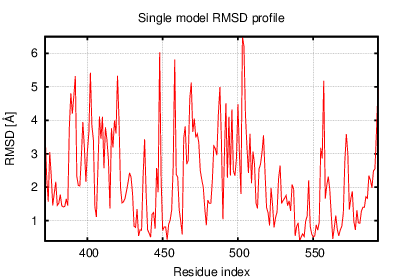
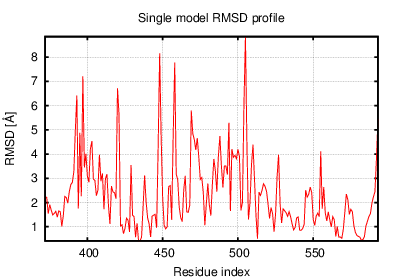
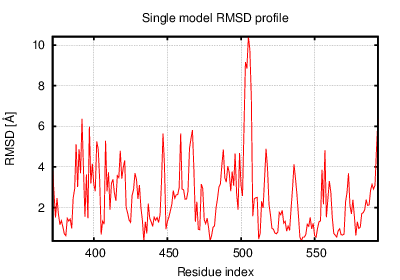
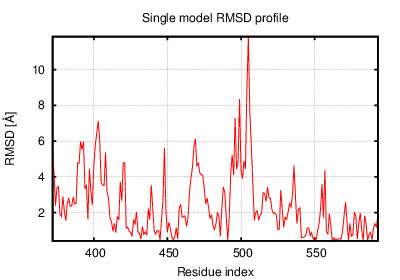
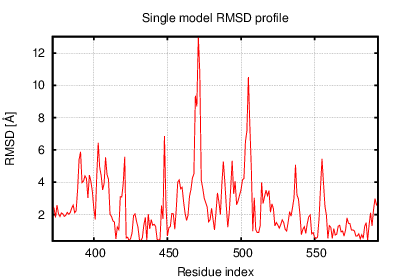
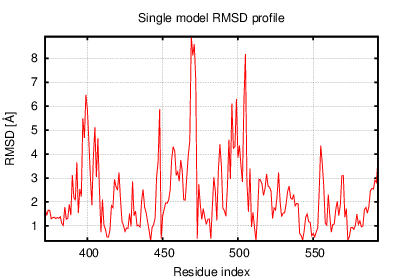
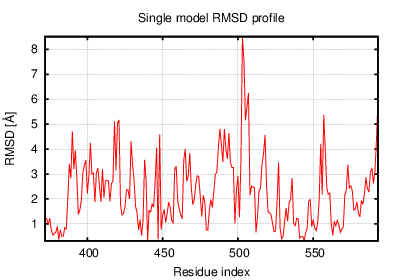
The table contains RMSD and GDT_TS values (calculated on the Cα atoms) between the predicted models and the input structure. Note that GDT_TS metric is intended as a more accurate measurement than the more common RMSD.
Read more about the root-mean-square deviation (RMSD) measure
Read more about the global distance test (GDT, also written as GDT_TS to represent "total score") measure.
| # | 1 | 2 | 3 | 4 | 5 | 6 | 7 | 8 | 9 | 10 | 11 | 12 |
| 1 | 0.00 | 2.39 | 2.43 | 2.55 | 2.80 | 2.01 | 2.30 | 2.53 | 2.14 | 2.60 | 2.69 | 2.36 |
| 2 | 2.39 | 0.00 | 1.96 | 2.35 | 2.38 | 2.22 | 2.39 | 2.38 | 2.65 | 2.52 | 3.09 | 2.25 |
| 3 | 2.43 | 1.96 | 0.00 | 2.08 | 2.27 | 2.01 | 2.38 | 2.16 | 3.08 | 2.96 | 3.19 | 2.18 |
| 4 | 2.55 | 2.35 | 2.08 | 0.00 | 2.05 | 2.29 | 2.59 | 2.18 | 3.04 | 3.26 | 3.30 | 2.07 |
| 5 | 2.80 | 2.38 | 2.27 | 2.05 | 0.00 | 2.33 | 2.62 | 2.50 | 3.31 | 3.28 | 3.48 | 2.36 |
| 6 | 2.01 | 2.22 | 2.01 | 2.29 | 2.33 | 0.00 | 1.82 | 2.40 | 2.53 | 2.68 | 2.65 | 2.09 |
| 7 | 2.30 | 2.39 | 2.38 | 2.59 | 2.62 | 1.82 | 0.00 | 2.70 | 2.40 | 2.49 | 2.59 | 2.55 |
| 8 | 2.53 | 2.38 | 2.16 | 2.18 | 2.50 | 2.40 | 2.70 | 0.00 | 2.93 | 3.39 | 3.55 | 2.06 |
| 9 | 2.14 | 2.65 | 3.08 | 3.04 | 3.31 | 2.53 | 2.40 | 2.93 | 0.00 | 2.45 | 2.69 | 2.93 |
| 10 | 2.60 | 2.52 | 2.96 | 3.26 | 3.28 | 2.68 | 2.49 | 3.39 | 2.45 | 0.00 | 2.32 | 3.18 |
| 11 | 2.69 | 3.09 | 3.19 | 3.30 | 3.48 | 2.65 | 2.59 | 3.55 | 2.69 | 2.32 | 0.00 | 3.21 |
| 12 | 2.36 | 2.25 | 2.18 | 2.07 | 2.36 | 2.09 | 2.55 | 2.06 | 2.93 | 3.18 | 3.21 | 0.00 |
The table contains RMSD values (calculated on the Cα atoms) between the predicted models.
Read more about the root-mean-square deviation (RMSD) measure.
| # | 1 | 2 | 3 | 4 | 5 | 6 | 7 | 8 | 9 | 10 | 11 | 12 |
| 1 | 1.00 | 0.70 | 0.70 | 0.69 | 0.67 | 0.78 | 0.75 | 0.69 | 0.73 | 0.72 | 0.70 | 0.69 |
| 2 | 0.70 | 1.00 | 0.79 | 0.71 | 0.69 | 0.77 | 0.72 | 0.72 | 0.65 | 0.69 | 0.62 | 0.74 |
| 3 | 0.70 | 0.79 | 1.00 | 0.73 | 0.73 | 0.77 | 0.70 | 0.75 | 0.62 | 0.64 | 0.60 | 0.74 |
| 4 | 0.69 | 0.71 | 0.73 | 1.00 | 0.78 | 0.75 | 0.71 | 0.77 | 0.63 | 0.60 | 0.61 | 0.77 |
| 5 | 0.67 | 0.69 | 0.73 | 0.78 | 1.00 | 0.76 | 0.69 | 0.74 | 0.60 | 0.61 | 0.59 | 0.73 |
| 6 | 0.78 | 0.77 | 0.77 | 0.75 | 0.76 | 1.00 | 0.80 | 0.75 | 0.70 | 0.67 | 0.67 | 0.74 |
| 7 | 0.75 | 0.72 | 0.70 | 0.71 | 0.69 | 0.80 | 1.00 | 0.72 | 0.70 | 0.70 | 0.69 | 0.71 |
| 8 | 0.69 | 0.72 | 0.75 | 0.77 | 0.74 | 0.75 | 0.72 | 1.00 | 0.63 | 0.61 | 0.59 | 0.80 |
| 9 | 0.73 | 0.65 | 0.62 | 0.63 | 0.60 | 0.70 | 0.70 | 0.63 | 1.00 | 0.74 | 0.72 | 0.62 |
| 10 | 0.72 | 0.69 | 0.64 | 0.60 | 0.61 | 0.67 | 0.70 | 0.61 | 0.74 | 1.00 | 0.74 | 0.62 |
| 11 | 0.70 | 0.62 | 0.60 | 0.61 | 0.59 | 0.67 | 0.69 | 0.59 | 0.72 | 0.74 | 1.00 | 0.62 |
| 12 | 0.69 | 0.74 | 0.74 | 0.77 | 0.73 | 0.74 | 0.71 | 0.80 | 0.62 | 0.62 | 0.62 | 1.00 |
The table contains GDT_TS values (calculated on the Cα atoms) between the predicted models.
Read more about the global distance test (GDT, also written as GDT_TS to represent "total score") measure.
© Laboratory of Theory of Biopolymers, Faculty of Chemistry, University of Warsaw 2013