Status: Done started: 2018-Jun-09 08:07:49 UTC
| Project Name | |
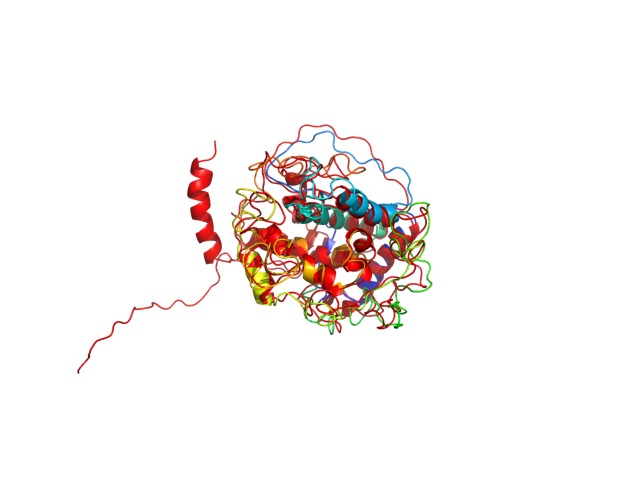
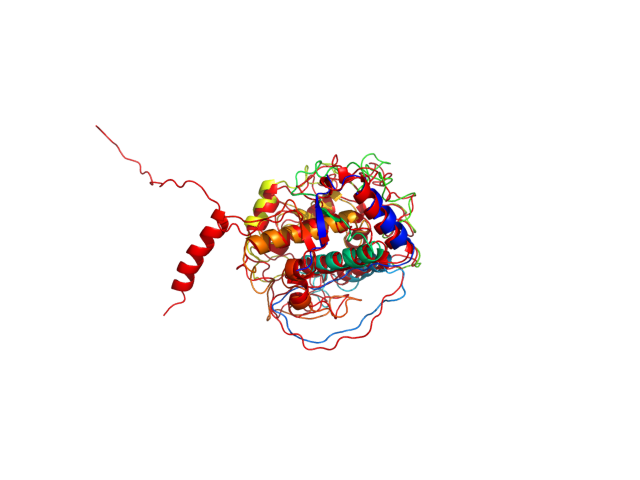
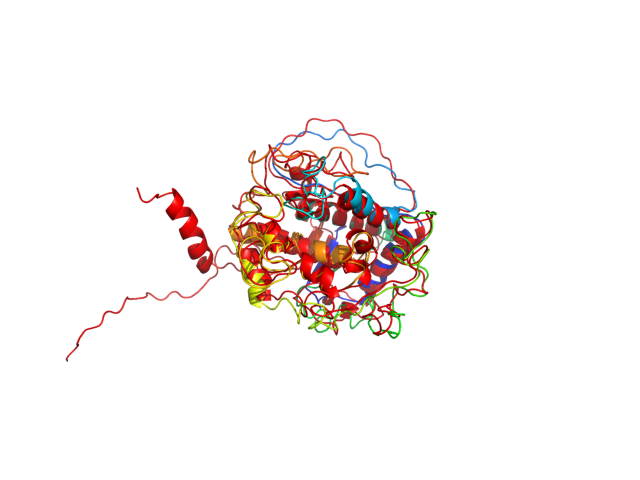
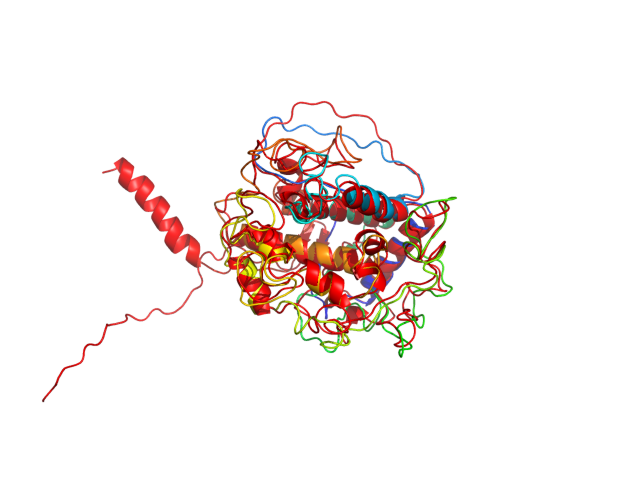
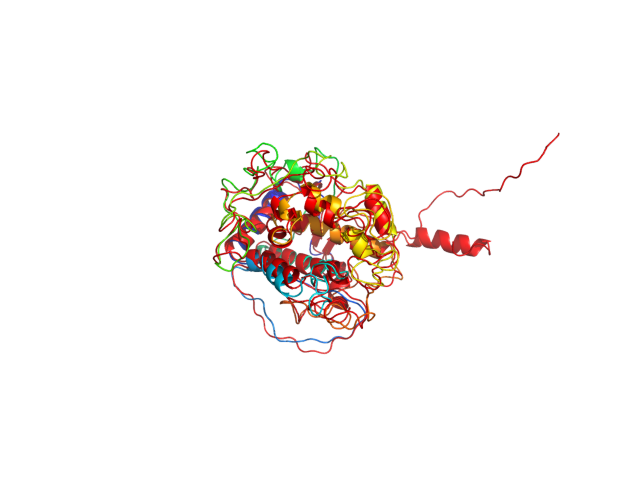
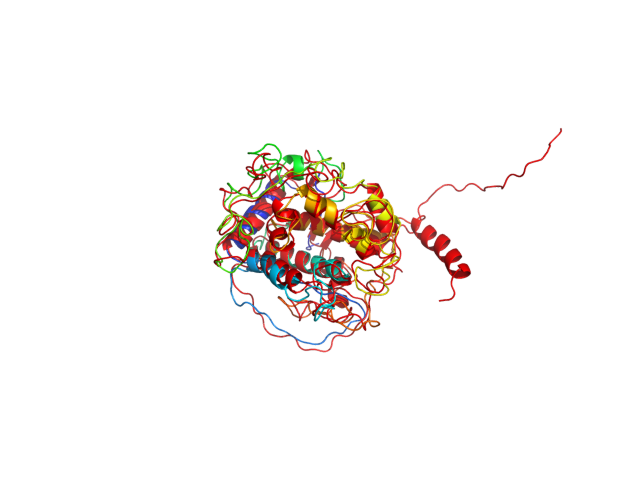
| Sequence | RRLLVRRNIF DLSAPEKDKF FAYLTLAKHT ISSDYVIPIG TYGQMKNGST PMFNDINIYD LFVWMHYYVS MDALLGGSEI WRDIDFAHEA PAFLPWHRLF LLRWEQEIQK LTGDENFTIP YWDWWDAEKC DICTDEYMGG QHPTNPNLLS PASFFSSWQI VCSRLEEYNS HQSLCNGTPE GPLRRNPGNH DKSRTPRLPS SADVEFCLSL TQYESGSMDK AANFSFRNTL EGFASPLTGI ADASQSSMHN ALHIYMNGTM SQVQGSANDP IFLLHHAFVD SIFEQWLRRH RPLQEVYPEA NAPIGHNRES YMVPFIPLYR NGDFFISSKD LGYDYSYLQD SDPDSFQDYI KSYLEQASRI WS |
| Secondary structure | CCCEEECCCC CCCHHHHHHH HHHHHHHHHH CCCCCCCCCC CCCCCCCCCC CCCCCCCHHH HHHHHHHHHH HHCCCCCCCC CCCCCCCCCC CCHHHHHHHH HHHHHHHHHH HCCCCCCCCC CCCCCCCCCC CCCCCCCCCC CCCCCCCCCC CCCCCCCCCC CCCCCCCCCC CCCCCCCCCC CCCCCCCCCC CCCCCCCCCC HHHHHHHHCC CCCCCCCCCC CCCCCHHHHH HCCCCCCCCC CCCCCCCCHH HHHHHHCHHH HCHHHHCCCC HHHHHHHHHH HHHHHHHHHC CCCCCCCCCC CCCCCCCCCC CCCCCCCCCC CHHHHCCHHH HCEEECCCCC CCCCCCCCCC CCCCCCCCCC CC |
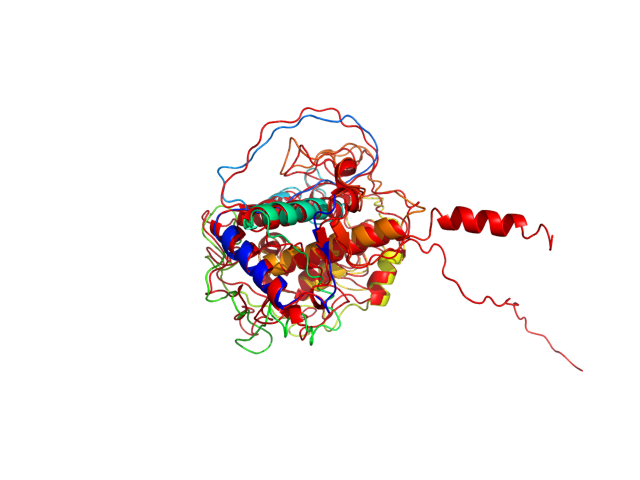
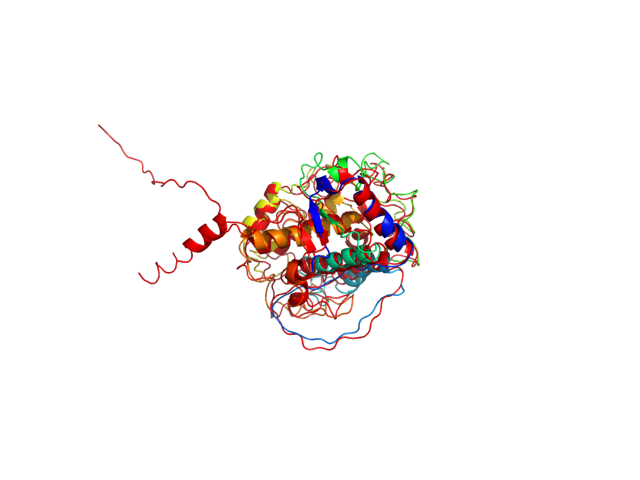
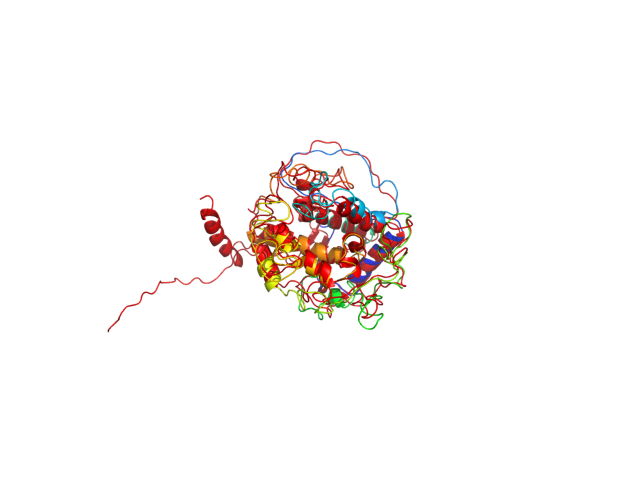
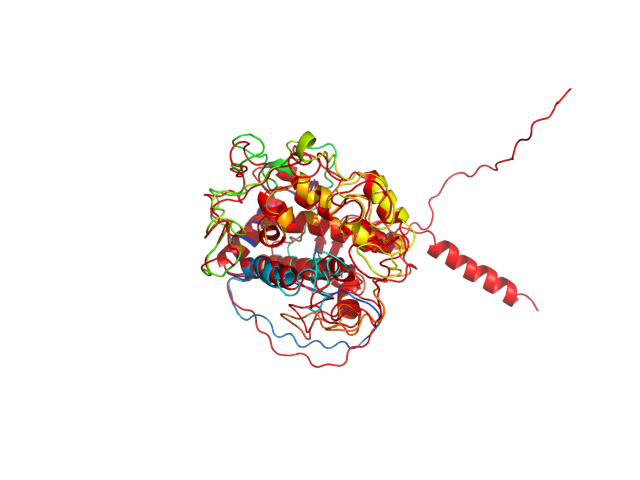
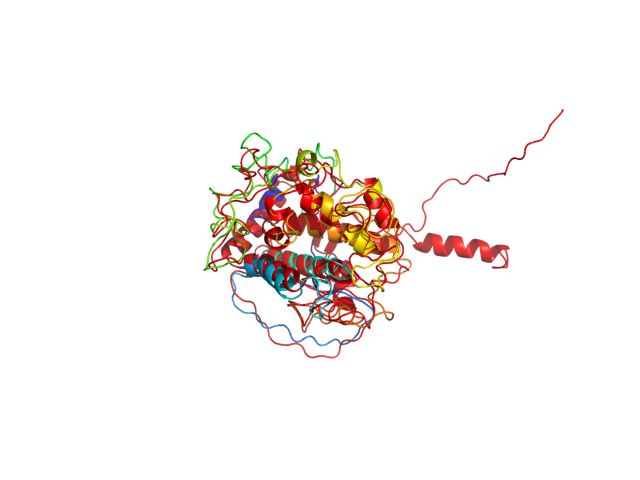
| Movie from predicted structures | To download the movie, right click on the desired file format:  
|
| Estimated finish time | 2018-Jun-09 13:14 UTC |
| Project Name |
| Project Name |
| Cluster # | 1 | 2 | 3 | 4 | 5 | 6 | 7 | 8 | 9 | 10 | 11 | 12 |
| Cluster density | 199.4 | 193.9 | 152.1 | 141.1 | 136.6 | 132.3 | 118.7 | 117.4 | 82.0 | 63.1 | 56.8 | 32.8 |
| Cluster size | 288 | 236 | 191 | 176 | 203 | 210 | 161 | 191 | 123 | 97 | 65 | 59 |
| Average cluster RMSD | 1.4 | 1.2 | 1.3 | 1.2 | 1.5 | 1.6 | 1.4 | 1.6 | 1.5 | 1.5 | 1.1 | 1.8 |
| # | 1 | 2 | 3 | 4 | 5 | 6 | 7 | 8 | 9 | 10 | 11 | 12 |
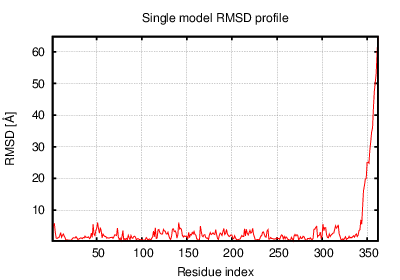
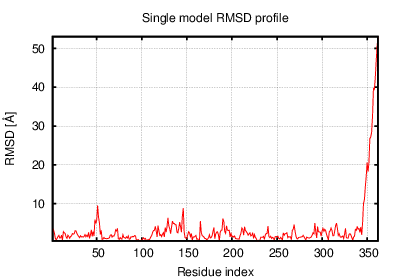
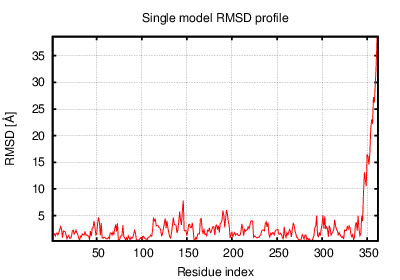
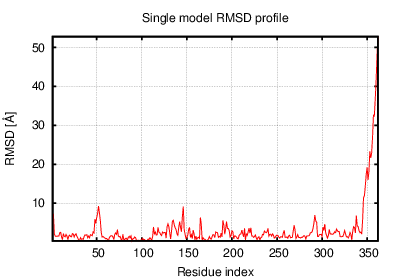
| RMSD | 6.61 | 7.93 | 6.65 | 6.26 | 6.85 | 5.61 | 5.74 | 6.24 | 6.80 | 5.17 | 6.33 | 5.58 |
| GDT_TS | 0.67 | 0.68 | 0.65 | 0.68 | 0.68 | 0.68 | 0.68 | 0.66 | 0.68 | 0.66 | 0.66 | 0.68 |
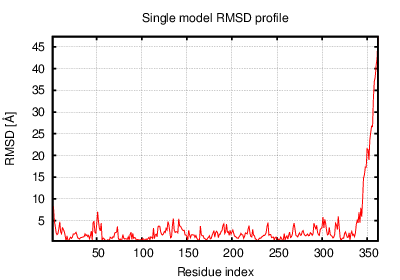
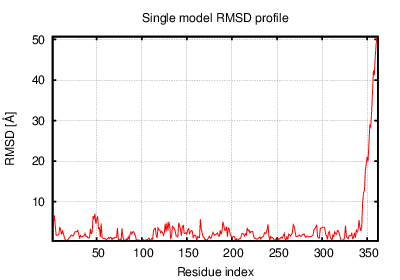
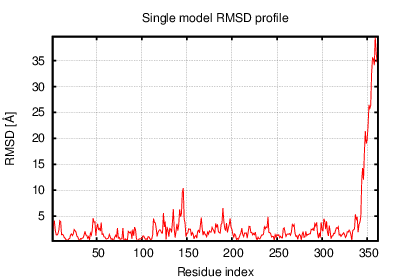
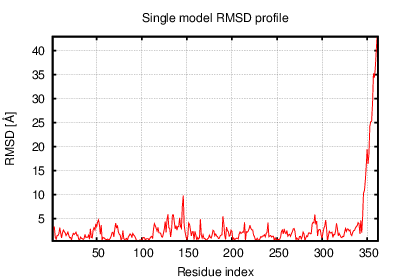
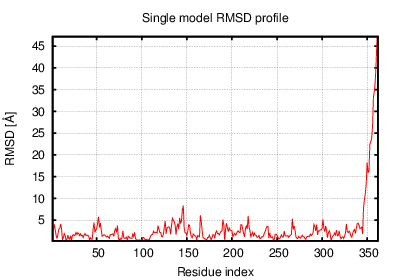
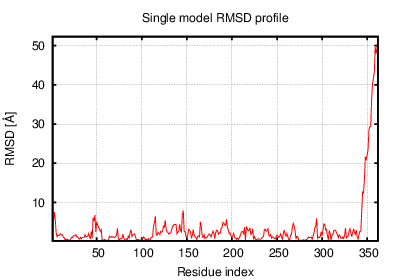
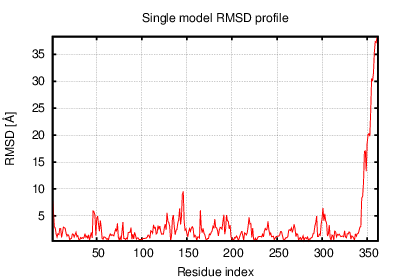
The table contains RMSD and GDT_TS values (calculated on the Cα atoms) between the predicted models and the input structure. Note that GDT_TS metric is intended as a more accurate measurement than the more common RMSD.
Read more about the root-mean-square deviation (RMSD) measure
Read more about the global distance test (GDT, also written as GDT_TS to represent "total score") measure.
| # | 1 | 2 | 3 | 4 | 5 | 6 | 7 | 8 | 9 | 10 | 11 | 12 |
| 1 | 0.00 | 4.15 | 2.46 | 4.49 | 2.30 | 3.44 | 2.24 | 3.57 | 2.61 | 3.35 | 3.91 | 2.82 |
| 2 | 4.15 | 0.00 | 3.17 | 2.78 | 3.48 | 6.06 | 3.81 | 3.15 | 4.77 | 4.23 | 3.00 | 4.55 |
| 3 | 2.46 | 3.17 | 0.00 | 3.46 | 2.50 | 4.40 | 2.02 | 2.65 | 3.32 | 3.00 | 2.64 | 3.16 |
| 4 | 4.49 | 2.78 | 3.46 | 0.00 | 3.90 | 5.85 | 3.59 | 2.72 | 5.15 | 3.72 | 2.60 | 4.27 |
| 5 | 2.30 | 3.48 | 2.50 | 3.90 | 0.00 | 3.92 | 2.49 | 3.64 | 2.39 | 3.44 | 3.75 | 2.96 |
| 6 | 3.44 | 6.06 | 4.40 | 5.85 | 3.92 | 0.00 | 3.53 | 5.03 | 2.92 | 3.60 | 5.30 | 2.91 |
| 7 | 2.24 | 3.81 | 2.02 | 3.59 | 2.49 | 3.53 | 0.00 | 2.82 | 2.97 | 2.60 | 2.93 | 2.50 |
| 8 | 3.57 | 3.15 | 2.65 | 2.72 | 3.64 | 5.03 | 2.82 | 0.00 | 4.61 | 2.87 | 2.00 | 3.71 |
| 9 | 2.61 | 4.77 | 3.32 | 5.15 | 2.39 | 2.92 | 2.97 | 4.61 | 0.00 | 3.75 | 4.72 | 2.90 |
| 10 | 3.35 | 4.23 | 3.00 | 3.72 | 3.44 | 3.60 | 2.60 | 2.87 | 3.75 | 0.00 | 3.06 | 2.30 |
| 11 | 3.91 | 3.00 | 2.64 | 2.60 | 3.75 | 5.30 | 2.93 | 2.00 | 4.72 | 3.06 | 0.00 | 3.86 |
| 12 | 2.82 | 4.55 | 3.16 | 4.27 | 2.96 | 2.91 | 2.50 | 3.71 | 2.90 | 2.30 | 3.86 | 0.00 |
The table contains RMSD values (calculated on the Cα atoms) between the predicted models.
Read more about the root-mean-square deviation (RMSD) measure.
| # | 1 | 2 | 3 | 4 | 5 | 6 | 7 | 8 | 9 | 10 | 11 | 12 |
| 1 | 1.00 | 0.73 | 0.76 | 0.77 | 0.77 | 0.71 | 0.79 | 0.79 | 0.72 | 0.71 | 0.73 | 0.73 |
| 2 | 0.73 | 1.00 | 0.73 | 0.78 | 0.76 | 0.68 | 0.73 | 0.71 | 0.71 | 0.70 | 0.70 | 0.73 |
| 3 | 0.76 | 0.73 | 1.00 | 0.73 | 0.74 | 0.67 | 0.77 | 0.74 | 0.74 | 0.74 | 0.76 | 0.72 |
| 4 | 0.77 | 0.78 | 0.73 | 1.00 | 0.77 | 0.70 | 0.73 | 0.76 | 0.71 | 0.71 | 0.73 | 0.73 |
| 5 | 0.77 | 0.76 | 0.74 | 0.77 | 1.00 | 0.70 | 0.73 | 0.73 | 0.76 | 0.73 | 0.70 | 0.73 |
| 6 | 0.71 | 0.68 | 0.67 | 0.70 | 0.70 | 1.00 | 0.71 | 0.70 | 0.75 | 0.72 | 0.72 | 0.75 |
| 7 | 0.79 | 0.73 | 0.77 | 0.73 | 0.73 | 0.71 | 1.00 | 0.77 | 0.75 | 0.73 | 0.76 | 0.74 |
| 8 | 0.79 | 0.71 | 0.74 | 0.76 | 0.73 | 0.70 | 0.77 | 1.00 | 0.72 | 0.74 | 0.77 | 0.72 |
| 9 | 0.72 | 0.71 | 0.74 | 0.71 | 0.76 | 0.75 | 0.75 | 0.72 | 1.00 | 0.75 | 0.72 | 0.76 |
| 10 | 0.71 | 0.70 | 0.74 | 0.71 | 0.73 | 0.72 | 0.73 | 0.74 | 0.75 | 1.00 | 0.74 | 0.78 |
| 11 | 0.73 | 0.70 | 0.76 | 0.73 | 0.70 | 0.72 | 0.76 | 0.77 | 0.72 | 0.74 | 1.00 | 0.73 |
| 12 | 0.73 | 0.73 | 0.72 | 0.73 | 0.73 | 0.75 | 0.74 | 0.72 | 0.76 | 0.78 | 0.73 | 1.00 |
The table contains GDT_TS values (calculated on the Cα atoms) between the predicted models.
Read more about the global distance test (GDT, also written as GDT_TS to represent "total score") measure.
© Laboratory of Theory of Biopolymers, Faculty of Chemistry, University of Warsaw 2013