Status: Done started: 2018-Oct-26 14:39:29 UTC
| Project Name | |
| Sequence | MAKAKFERSK PHVNIGTIGH VDHGKTTLTA AITTVLAKAG GAEARGYDQI DAAPEERERG ITISTAHVEY ETETRHYAHV DCPGHADYVK NMITGAAQMD GGILVVSAAD GPMPQTREHI LLSRQVGVPY IVVFLNKCDM VDDEELLELV EMEVRDLLSE YGFPGDDIPV IKGSALKALQ GEADWEAKII ELMAEVDAYI PTPERETDKP FLMPVEDVFS ITGRGTVATG RVERGIVKVG DVVEIIGLAE ENASTTVTGV EMFRKLLDQA QAGDNIGALL RGVAREDIQR GQVLAKSGSV KAHAKFKAEV FVLSKEEGGR HTPFFANYRP QFYFRTTDVT GIIQLPEGTE MVMPGDNVEM TIELIAPIAI EEGTKFSIRE GGRTVGYGVV ATIVE |
| Secondary structure | CCCCCCCCCC CEEEEEEECC CCCCHHHHHH HHHHHHHCCC CCCCCCHHHH CCCHHHHHHC CCCCCEEEEE ECCCCEEEEE ECCCCCCCHH HHHHHHCCCC EEEEEEECCC CCCHHHHHHH HHHHHCCCCE EEEEEECCCC CCCHHHHHHH HHHHHHHHHH CCCCCCCCCE EECCCCCCCC CCCHHHHHHH HHHHHHHHHC CCCCCCCCCC CEEECCEEEE ECCCEEEEEE ECCCCEEECC CEEEEECCCC CCEEEEEEEE ECCCCCCCEE ECCCEEEEEE CCCCCCCCCC CCEEECCCCC CCEEEEEEEE EECCCCCCCC CCCCCCCCCC EEEECCEEEE EEEECCCCCC CCCCCCEEEE EEEEEEEECC CCCCEEEEEE CCEEEEEEEE EEECC |
| Movie from predicted structures | To download the movie, right click on the desired file format:  
|
| Estimated finish time | 2018-Oct-26 19:50 UTC |
| Project Name |
| Project Name |
| Cluster # | 1 | 2 | 3 | 4 | 5 | 6 | 7 | 8 | 9 | 10 | 11 | 12 |
| Cluster density | 257.3 | 166.0 | 165.7 | 146.0 | 145.8 | 136.7 | 121.1 | 111.0 | 109.2 | 90.7 | 73.7 | 63.7 |
| Cluster size | 339 | 208 | 205 | 174 | 181 | 171 | 150 | 146 | 138 | 115 | 91 | 82 |
| Average cluster RMSD | 1.3 | 1.3 | 1.2 | 1.2 | 1.2 | 1.3 | 1.2 | 1.3 | 1.3 | 1.3 | 1.2 | 1.3 |
| # | 1 | 2 | 3 | 4 | 5 | 6 | 7 | 8 | 9 | 10 | 11 | 12 |
| RMSD | 3.09 | 3.06 | 2.85 | 3.07 | 2.74 | 2.92 | 3.03 | 2.53 | 2.85 | 2.78 | 2.67 | 3.05 |
| GDT_TS | 0.59 | 0.62 | 0.64 | 0.61 | 0.65 | 0.63 | 0.61 | 0.69 | 0.67 | 0.64 | 0.63 | 0.64 |
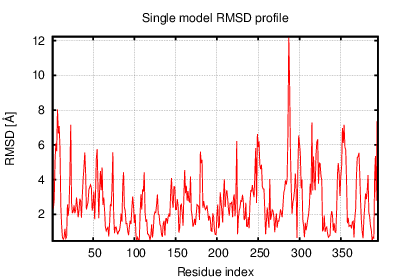
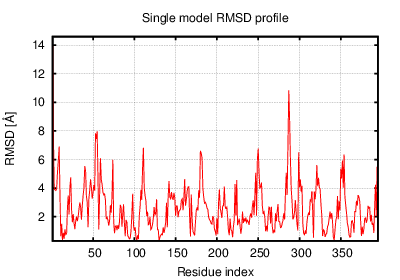
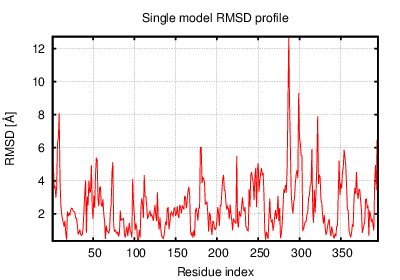
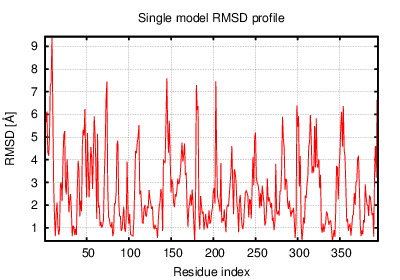
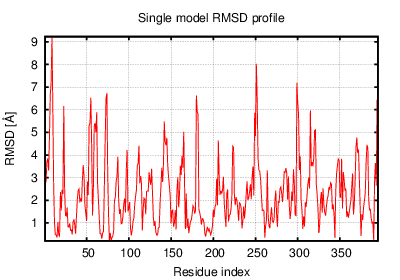
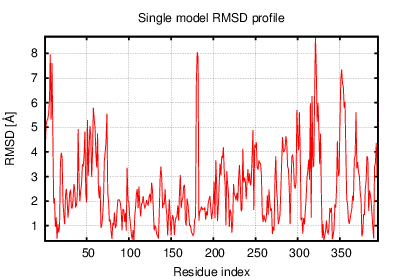
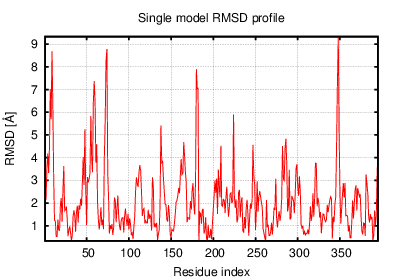
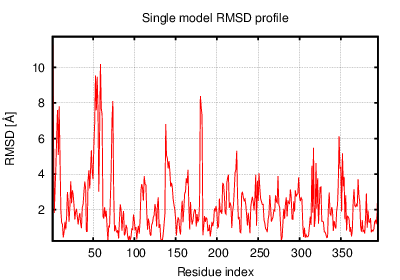
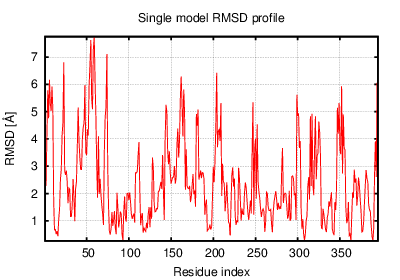
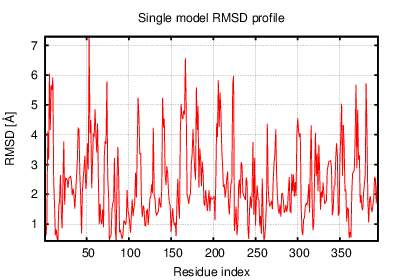
The table contains RMSD and GDT_TS values (calculated on the Cα atoms) between the predicted models and the input structure. Note that GDT_TS metric is intended as a more accurate measurement than the more common RMSD.
Read more about the root-mean-square deviation (RMSD) measure
Read more about the global distance test (GDT, also written as GDT_TS to represent "total score") measure.
| # | 1 | 2 | 3 | 4 | 5 | 6 | 7 | 8 | 9 | 10 | 11 | 12 |
| 1 | 0.00 | 2.13 | 2.10 | 2.25 | 2.10 | 2.23 | 2.23 | 2.81 | 2.73 | 2.20 | 2.83 | 2.32 |
| 2 | 2.13 | 0.00 | 2.14 | 2.18 | 2.09 | 2.58 | 2.13 | 2.92 | 2.47 | 2.24 | 2.73 | 2.33 |
| 3 | 2.10 | 2.14 | 0.00 | 2.29 | 2.19 | 2.23 | 2.24 | 2.79 | 2.71 | 2.47 | 2.88 | 2.33 |
| 4 | 2.25 | 2.18 | 2.29 | 0.00 | 2.06 | 2.48 | 1.76 | 2.66 | 2.72 | 2.19 | 2.66 | 2.38 |
| 5 | 2.10 | 2.09 | 2.19 | 2.06 | 0.00 | 2.54 | 2.12 | 2.36 | 2.39 | 2.22 | 2.33 | 2.49 |
| 6 | 2.23 | 2.58 | 2.23 | 2.48 | 2.54 | 0.00 | 2.48 | 2.88 | 2.83 | 2.26 | 2.86 | 2.01 |
| 7 | 2.23 | 2.13 | 2.24 | 1.76 | 2.12 | 2.48 | 0.00 | 2.47 | 2.53 | 2.08 | 2.58 | 2.38 |
| 8 | 2.81 | 2.92 | 2.79 | 2.66 | 2.36 | 2.88 | 2.47 | 0.00 | 2.24 | 2.42 | 2.40 | 2.94 |
| 9 | 2.73 | 2.47 | 2.71 | 2.72 | 2.39 | 2.83 | 2.53 | 2.24 | 0.00 | 2.39 | 2.45 | 2.77 |
| 10 | 2.20 | 2.24 | 2.47 | 2.19 | 2.22 | 2.26 | 2.08 | 2.42 | 2.39 | 0.00 | 2.25 | 2.35 |
| 11 | 2.83 | 2.73 | 2.88 | 2.66 | 2.33 | 2.86 | 2.58 | 2.40 | 2.45 | 2.25 | 0.00 | 2.96 |
| 12 | 2.32 | 2.33 | 2.33 | 2.38 | 2.49 | 2.01 | 2.38 | 2.94 | 2.77 | 2.35 | 2.96 | 0.00 |
The table contains RMSD values (calculated on the Cα atoms) between the predicted models.
Read more about the root-mean-square deviation (RMSD) measure.
| # | 1 | 2 | 3 | 4 | 5 | 6 | 7 | 8 | 9 | 10 | 11 | 12 |
| 1 | 1.00 | 0.74 | 0.72 | 0.70 | 0.74 | 0.71 | 0.73 | 0.65 | 0.65 | 0.73 | 0.64 | 0.70 |
| 2 | 0.74 | 1.00 | 0.73 | 0.73 | 0.74 | 0.68 | 0.75 | 0.65 | 0.67 | 0.74 | 0.66 | 0.71 |
| 3 | 0.72 | 0.73 | 1.00 | 0.71 | 0.71 | 0.74 | 0.72 | 0.64 | 0.64 | 0.69 | 0.62 | 0.73 |
| 4 | 0.70 | 0.73 | 0.71 | 1.00 | 0.74 | 0.67 | 0.78 | 0.66 | 0.65 | 0.70 | 0.64 | 0.69 |
| 5 | 0.74 | 0.74 | 0.71 | 0.74 | 1.00 | 0.68 | 0.75 | 0.72 | 0.69 | 0.73 | 0.69 | 0.68 |
| 6 | 0.71 | 0.68 | 0.74 | 0.67 | 0.68 | 1.00 | 0.67 | 0.63 | 0.63 | 0.70 | 0.62 | 0.78 |
| 7 | 0.73 | 0.75 | 0.72 | 0.78 | 0.75 | 0.67 | 1.00 | 0.70 | 0.68 | 0.76 | 0.67 | 0.70 |
| 8 | 0.65 | 0.65 | 0.64 | 0.66 | 0.72 | 0.63 | 0.70 | 1.00 | 0.75 | 0.71 | 0.69 | 0.63 |
| 9 | 0.65 | 0.67 | 0.64 | 0.65 | 0.69 | 0.63 | 0.68 | 0.75 | 1.00 | 0.71 | 0.70 | 0.64 |
| 10 | 0.73 | 0.74 | 0.69 | 0.70 | 0.73 | 0.70 | 0.76 | 0.71 | 0.71 | 1.00 | 0.71 | 0.69 |
| 11 | 0.64 | 0.66 | 0.62 | 0.64 | 0.69 | 0.62 | 0.67 | 0.69 | 0.70 | 0.71 | 1.00 | 0.61 |
| 12 | 0.70 | 0.71 | 0.73 | 0.69 | 0.68 | 0.78 | 0.70 | 0.63 | 0.64 | 0.69 | 0.61 | 1.00 |
The table contains GDT_TS values (calculated on the Cα atoms) between the predicted models.
Read more about the global distance test (GDT, also written as GDT_TS to represent "total score") measure.
© Laboratory of Theory of Biopolymers, Faculty of Chemistry, University of Warsaw 2013