Status: Done started: 2018-Apr-26 02:34:54 UTC
| Project Name | 1 |
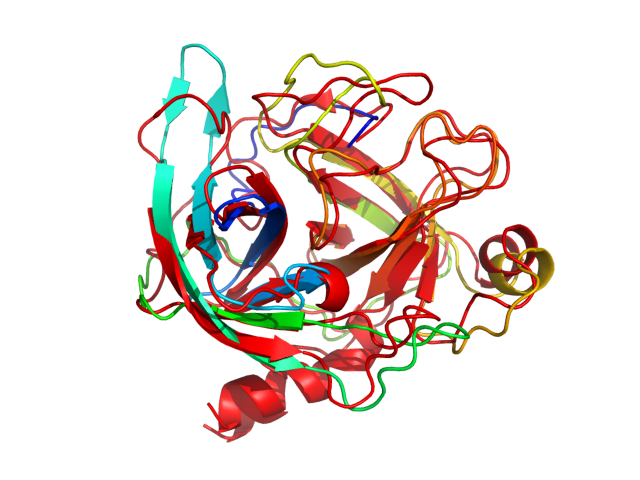
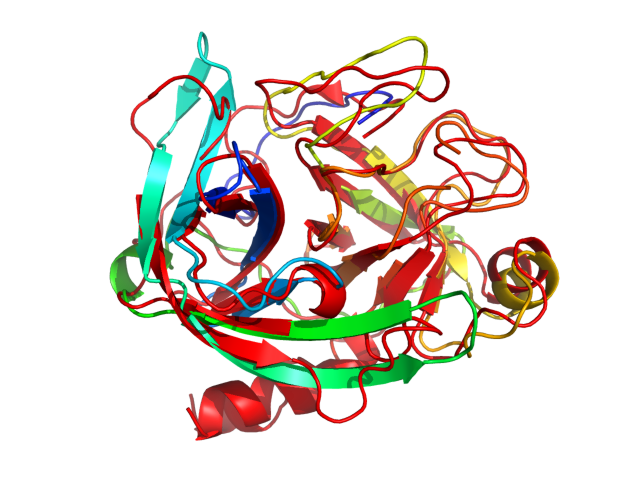
| Sequence | IVGGYTCAAN SIPYQVSLNS GSHFCGGSLI NSQWVVSAAH CYKSRIQVRL GEHNIDVLEG NEQFINAAKI ITHPNFNGNT LDNDIMLIKL SSPATLNSRV ATVSLPRSCA AAGTECLISG WGNTKSSGSS YPSLLQCLKA PVLSDSSCKS SYPGQITGNM ICVGFLEGGK DSCQGDSGGP VVCNGQLQGI VSWGYGCAQK NKPGVYTKVC NYVNWIQQTI AAN |
| Secondary structure | CCCCEECCCC CCCCEEEEEC CCEEEEEEEE ECCEEEECCC CCCCCCEEEE CCCCCCCCCC CCEEEEEEEE EECCCCCCCC CCCCCEEEEE CCCCCCCCCC CCCCCCCCCC CCCCEEEEEE CCCCCCCCCC CCCCCEEEEE ECCCHHHHHH HCCCCCCCCE EEECCCCCCC CCCCCCCCCE EEECCEEEEE EEECCCCCCC CCCEEEEECC CCHHHHHHHH HCC |
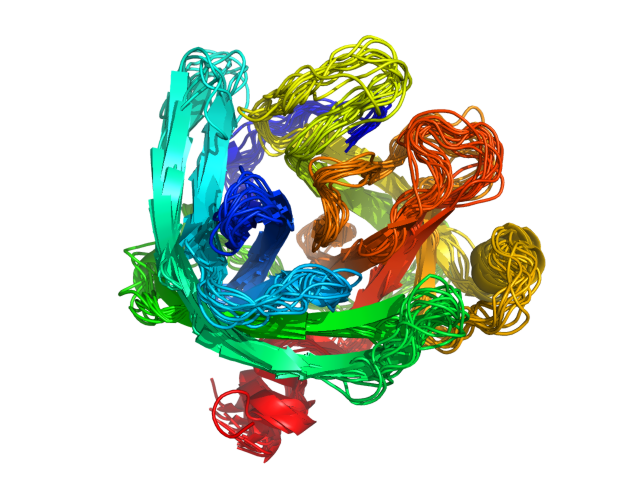
| Movie from predicted structures | To download the movie, right click on the desired file format:  
|
| Estimated finish time | 2018-Apr-26 07:23 UTC |
| Project Name | 1 |


| Project Name | 1 |
| Cluster # | 1 | 2 | 3 | 4 | 5 | 6 | 7 | 8 | 9 | 10 | 11 | 12 |
| Cluster density | 212.5 | 210.0 | 154.4 | 148.1 | 140.6 | 138.2 | 122.3 | 118.5 | 87.0 | 81.0 | 47.4 | 29.3 |
| Cluster size | 269 | 293 | 197 | 211 | 187 | 186 | 154 | 166 | 122 | 119 | 58 | 38 |
| Average cluster RMSD | 1.3 | 1.4 | 1.3 | 1.4 | 1.3 | 1.3 | 1.3 | 1.4 | 1.4 | 1.5 | 1.2 | 1.3 |
| # | 1 | 2 | 3 | 4 | 5 | 6 | 7 | 8 | 9 | 10 | 11 | 12 |
| RMSD | 3.02 | 2.88 | 2.83 | 2.69 | 2.43 | 3.09 | 3.14 | 3.13 | 2.91 | 3.03 | 3.15 | 3.18 |
| GDT_TS | 0.67 | 0.66 | 0.67 | 0.67 | 0.70 | 0.67 | 0.66 | 0.64 | 0.64 | 0.63 | 0.67 | 0.65 |
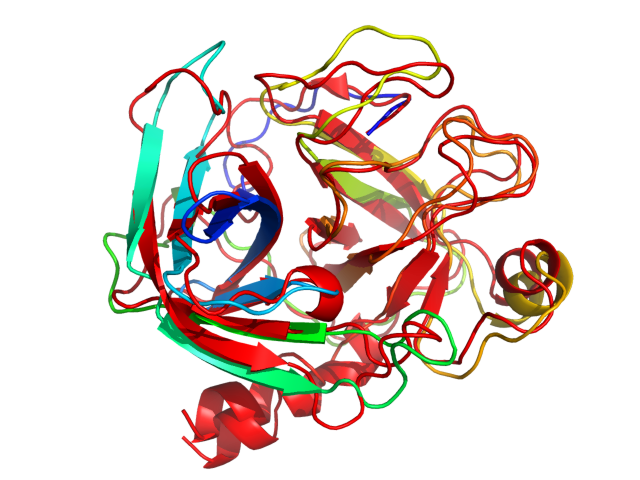
The table contains RMSD and GDT_TS values (calculated on the Cα atoms) between the predicted models and the input structure. Note that GDT_TS metric is intended as a more accurate measurement than the more common RMSD.
Read more about the root-mean-square deviation (RMSD) measure
Read more about the global distance test (GDT, also written as GDT_TS to represent "total score") measure.
| # | 1 | 2 | 3 | 4 | 5 | 6 | 7 | 8 | 9 | 10 | 11 | 12 |
| 1 | 0.00 | 2.14 | 1.96 | 2.54 | 2.41 | 1.99 | 2.00 | 2.34 | 2.05 | 2.44 | 2.14 | 2.16 |
| 2 | 2.14 | 0.00 | 1.99 | 2.19 | 2.07 | 2.08 | 2.13 | 1.99 | 2.09 | 2.55 | 2.02 | 2.09 |
| 3 | 1.96 | 1.99 | 0.00 | 2.18 | 2.31 | 1.87 | 2.01 | 1.87 | 2.01 | 2.61 | 2.22 | 1.91 |
| 4 | 2.54 | 2.19 | 2.18 | 0.00 | 2.25 | 2.52 | 2.69 | 2.32 | 2.34 | 2.87 | 2.71 | 2.45 |
| 5 | 2.41 | 2.07 | 2.31 | 2.25 | 0.00 | 2.53 | 2.53 | 2.49 | 2.29 | 2.30 | 2.44 | 2.51 |
| 6 | 1.99 | 2.08 | 1.87 | 2.52 | 2.53 | 0.00 | 1.84 | 1.92 | 2.02 | 2.64 | 1.99 | 1.63 |
| 7 | 2.00 | 2.13 | 2.01 | 2.69 | 2.53 | 1.84 | 0.00 | 2.03 | 2.12 | 2.56 | 2.03 | 1.94 |
| 8 | 2.34 | 1.99 | 1.87 | 2.32 | 2.49 | 1.92 | 2.03 | 0.00 | 2.28 | 2.97 | 2.25 | 1.83 |
| 9 | 2.05 | 2.09 | 2.01 | 2.34 | 2.29 | 2.02 | 2.12 | 2.28 | 0.00 | 2.34 | 2.06 | 2.16 |
| 10 | 2.44 | 2.55 | 2.61 | 2.87 | 2.30 | 2.64 | 2.56 | 2.97 | 2.34 | 0.00 | 2.49 | 2.87 |
| 11 | 2.14 | 2.02 | 2.22 | 2.71 | 2.44 | 1.99 | 2.03 | 2.25 | 2.06 | 2.49 | 0.00 | 2.24 |
| 12 | 2.16 | 2.09 | 1.91 | 2.45 | 2.51 | 1.63 | 1.94 | 1.83 | 2.16 | 2.87 | 2.24 | 0.00 |
The table contains RMSD values (calculated on the Cα atoms) between the predicted models.
Read more about the root-mean-square deviation (RMSD) measure.
| # | 1 | 2 | 3 | 4 | 5 | 6 | 7 | 8 | 9 | 10 | 11 | 12 |
| 1 | 1.00 | 0.75 | 0.76 | 0.75 | 0.73 | 0.75 | 0.75 | 0.73 | 0.75 | 0.71 | 0.74 | 0.74 |
| 2 | 0.75 | 1.00 | 0.75 | 0.76 | 0.76 | 0.73 | 0.77 | 0.79 | 0.74 | 0.71 | 0.75 | 0.75 |
| 3 | 0.76 | 0.75 | 1.00 | 0.77 | 0.73 | 0.76 | 0.75 | 0.78 | 0.73 | 0.71 | 0.74 | 0.76 |
| 4 | 0.75 | 0.76 | 0.77 | 1.00 | 0.73 | 0.73 | 0.74 | 0.75 | 0.75 | 0.71 | 0.73 | 0.75 |
| 5 | 0.73 | 0.76 | 0.73 | 0.73 | 1.00 | 0.71 | 0.73 | 0.73 | 0.72 | 0.75 | 0.73 | 0.74 |
| 6 | 0.75 | 0.73 | 0.76 | 0.73 | 0.71 | 1.00 | 0.78 | 0.75 | 0.76 | 0.69 | 0.75 | 0.82 |
| 7 | 0.75 | 0.77 | 0.75 | 0.74 | 0.73 | 0.78 | 1.00 | 0.77 | 0.78 | 0.72 | 0.74 | 0.77 |
| 8 | 0.73 | 0.79 | 0.78 | 0.75 | 0.73 | 0.75 | 0.77 | 1.00 | 0.74 | 0.66 | 0.72 | 0.78 |
| 9 | 0.75 | 0.74 | 0.73 | 0.75 | 0.72 | 0.76 | 0.78 | 0.74 | 1.00 | 0.71 | 0.75 | 0.76 |
| 10 | 0.71 | 0.71 | 0.71 | 0.71 | 0.75 | 0.69 | 0.72 | 0.66 | 0.71 | 1.00 | 0.70 | 0.69 |
| 11 | 0.74 | 0.75 | 0.74 | 0.73 | 0.73 | 0.75 | 0.74 | 0.72 | 0.75 | 0.70 | 1.00 | 0.73 |
| 12 | 0.74 | 0.75 | 0.76 | 0.75 | 0.74 | 0.82 | 0.77 | 0.78 | 0.76 | 0.69 | 0.73 | 1.00 |
The table contains GDT_TS values (calculated on the Cα atoms) between the predicted models.
Read more about the global distance test (GDT, also written as GDT_TS to represent "total score") measure.
© Laboratory of Theory of Biopolymers, Faculty of Chemistry, University of Warsaw 2013