Status: Done started: 2018-Sep-18 01:57:04 UTC
| Project Name | |
| Sequence | PTEFLYTSKI AAISWAATGG RQQRVYFQDL NGKIREAQRG GDNPWTGGSS QNVIGEAKLF SPLAAVTWKS AQGIQIRVYC VNKDNILSEF VYDGSKWITG QLGSVGVKVG SNSKLAALQW GGSESAPPQI RVYYQKSNGS GSSIHEYVWS GKWTAGASFG STVPGTGIGA TAIGPGRLRI YYQATDNKIR EHCWDSNSWY VGGFSASASA GVSIAAISWG STPNIRVYWQ KGREELYEAA YGGSWNTPGQ IKDASRPTPS LPDTFIAANS SGNIDISVFF QASGVSLQQW QWISGKGWSI GAVVPTG |
| Secondary structure | CCCCCCCCCE EEEEECCCCC CEEEEEEECC CCEEEEEEEE CCCCCEECCC CCEEEECCCC CCCEEEEEEE CCEEEEEEEE ECCCCCEEEE EEECCCEEEC CCCCCCCCCC CCCCCEEEEE CCCCCCCCEE EEEECCCCCC CEEEEEEEEC CCEEEEEEEE EECCCCCEEE EEEECCEEEE EEECCCCEEE EEEECCCCEE EEEEEEECCC CCEEEEEEEC CCCEEEEEEE CCCCCEEEEE ECCCCCCCEE ECCCCCCCCC CCCCCCEEEE ECCCEEEEEE EECCCEEEEE EEECCCEEEE CCCCCCC |
| Movie from predicted structures | To download the movie, right click on the desired file format:  
|
| Estimated finish time | 2018-Sep-18 06:56 UTC |
| Project Name |
| Project Name |
| Cluster # | 1 | 2 | 3 | 4 | 5 | 6 | 7 | 8 | 9 | 10 | 11 | 12 |
| Cluster density | 215.4 | 192.8 | 191.2 | 158.8 | 149.9 | 130.0 | 129.1 | 119.5 | 116.5 | 99.0 | 83.7 | 80.2 |
| Cluster size | 270 | 231 | 227 | 188 | 179 | 151 | 148 | 143 | 147 | 120 | 100 | 96 |
| Average cluster RMSD | 1.3 | 1.2 | 1.2 | 1.2 | 1.2 | 1.2 | 1.1 | 1.2 | 1.3 | 1.2 | 1.2 | 1.2 |
| # | 1 | 2 | 3 | 4 | 5 | 6 | 7 | 8 | 9 | 10 | 11 | 12 |
| RMSD | 2.62 | 2.56 | 2.48 | 2.68 | 2.56 | 2.56 | 2.65 | 2.47 | 2.32 | 2.53 | 2.73 | 2.51 |
| GDT_TS | 0.65 | 0.65 | 0.68 | 0.64 | 0.64 | 0.67 | 0.65 | 0.68 | 0.68 | 0.65 | 0.66 | 0.67 |
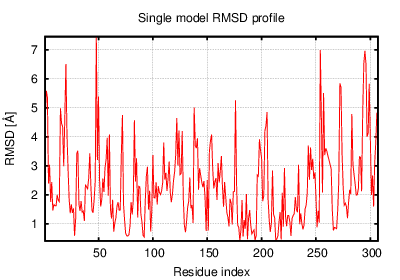
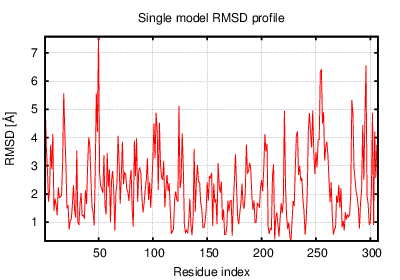
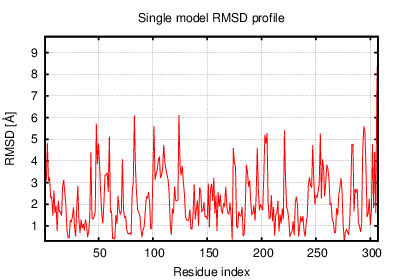
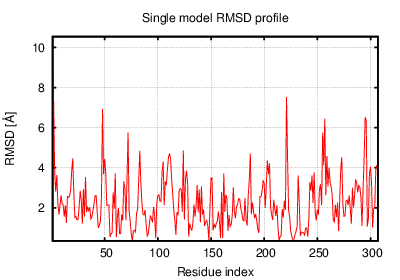
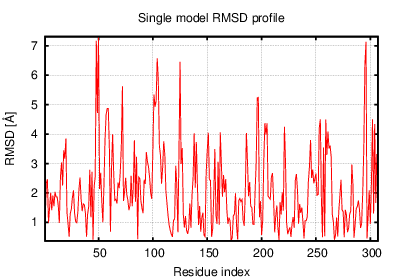
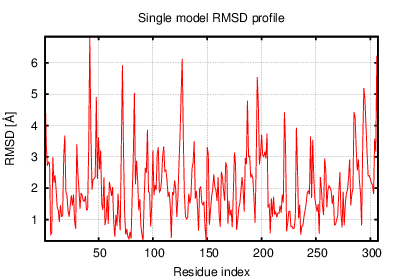
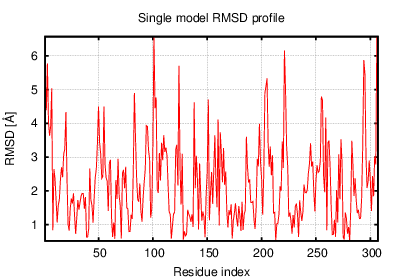
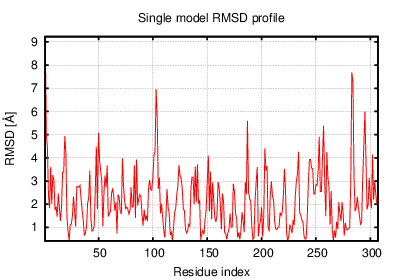
The table contains RMSD and GDT_TS values (calculated on the Cα atoms) between the predicted models and the input structure. Note that GDT_TS metric is intended as a more accurate measurement than the more common RMSD.
Read more about the root-mean-square deviation (RMSD) measure
Read more about the global distance test (GDT, also written as GDT_TS to represent "total score") measure.
| # | 1 | 2 | 3 | 4 | 5 | 6 | 7 | 8 | 9 | 10 | 11 | 12 |
| 1 | 0.00 | 2.43 | 1.97 | 1.97 | 2.30 | 2.15 | 2.03 | 2.47 | 2.06 | 2.33 | 2.51 | 2.59 |
| 2 | 2.43 | 0.00 | 2.31 | 2.59 | 1.86 | 2.10 | 2.38 | 1.86 | 2.35 | 2.17 | 2.39 | 2.07 |
| 3 | 1.97 | 2.31 | 0.00 | 1.98 | 2.16 | 1.97 | 2.20 | 2.40 | 2.02 | 2.07 | 2.40 | 2.61 |
| 4 | 1.97 | 2.59 | 1.98 | 0.00 | 2.43 | 2.18 | 2.26 | 2.52 | 2.30 | 2.41 | 2.47 | 2.76 |
| 5 | 2.30 | 1.86 | 2.16 | 2.43 | 0.00 | 1.96 | 2.28 | 2.17 | 2.37 | 2.38 | 2.19 | 1.94 |
| 6 | 2.15 | 2.10 | 1.97 | 2.18 | 1.96 | 0.00 | 2.15 | 2.13 | 2.28 | 2.14 | 2.26 | 2.36 |
| 7 | 2.03 | 2.38 | 2.20 | 2.26 | 2.28 | 2.15 | 0.00 | 2.26 | 2.17 | 2.40 | 2.48 | 2.38 |
| 8 | 2.47 | 1.86 | 2.40 | 2.52 | 2.17 | 2.13 | 2.26 | 0.00 | 2.29 | 2.14 | 2.61 | 2.28 |
| 9 | 2.06 | 2.35 | 2.02 | 2.30 | 2.37 | 2.28 | 2.17 | 2.29 | 0.00 | 2.15 | 2.61 | 2.61 |
| 10 | 2.33 | 2.17 | 2.07 | 2.41 | 2.38 | 2.14 | 2.40 | 2.14 | 2.15 | 0.00 | 2.48 | 2.46 |
| 11 | 2.51 | 2.39 | 2.40 | 2.47 | 2.19 | 2.26 | 2.48 | 2.61 | 2.61 | 2.48 | 0.00 | 2.59 |
| 12 | 2.59 | 2.07 | 2.61 | 2.76 | 1.94 | 2.36 | 2.38 | 2.28 | 2.61 | 2.46 | 2.59 | 0.00 |
The table contains RMSD values (calculated on the Cα atoms) between the predicted models.
Read more about the root-mean-square deviation (RMSD) measure.
| # | 1 | 2 | 3 | 4 | 5 | 6 | 7 | 8 | 9 | 10 | 11 | 12 |
| 1 | 1.00 | 0.67 | 0.76 | 0.74 | 0.70 | 0.72 | 0.77 | 0.67 | 0.74 | 0.71 | 0.73 | 0.66 |
| 2 | 0.67 | 1.00 | 0.71 | 0.66 | 0.77 | 0.72 | 0.69 | 0.78 | 0.67 | 0.72 | 0.72 | 0.76 |
| 3 | 0.76 | 0.71 | 1.00 | 0.75 | 0.74 | 0.76 | 0.76 | 0.70 | 0.74 | 0.74 | 0.77 | 0.68 |
| 4 | 0.74 | 0.66 | 0.75 | 1.00 | 0.68 | 0.71 | 0.75 | 0.67 | 0.70 | 0.69 | 0.72 | 0.64 |
| 5 | 0.70 | 0.77 | 0.74 | 0.68 | 1.00 | 0.77 | 0.71 | 0.73 | 0.68 | 0.70 | 0.76 | 0.78 |
| 6 | 0.72 | 0.72 | 0.76 | 0.71 | 0.77 | 1.00 | 0.74 | 0.76 | 0.71 | 0.76 | 0.76 | 0.74 |
| 7 | 0.77 | 0.69 | 0.76 | 0.75 | 0.71 | 0.74 | 1.00 | 0.71 | 0.75 | 0.72 | 0.75 | 0.69 |
| 8 | 0.67 | 0.78 | 0.70 | 0.67 | 0.73 | 0.76 | 0.71 | 1.00 | 0.70 | 0.76 | 0.72 | 0.74 |
| 9 | 0.74 | 0.67 | 0.74 | 0.70 | 0.68 | 0.71 | 0.75 | 0.70 | 1.00 | 0.72 | 0.72 | 0.67 |
| 10 | 0.71 | 0.72 | 0.74 | 0.69 | 0.70 | 0.76 | 0.72 | 0.76 | 0.72 | 1.00 | 0.76 | 0.69 |
| 11 | 0.73 | 0.72 | 0.77 | 0.72 | 0.76 | 0.76 | 0.75 | 0.72 | 0.72 | 0.76 | 1.00 | 0.70 |
| 12 | 0.66 | 0.76 | 0.68 | 0.64 | 0.78 | 0.74 | 0.69 | 0.74 | 0.67 | 0.69 | 0.70 | 1.00 |
The table contains GDT_TS values (calculated on the Cα atoms) between the predicted models.
Read more about the global distance test (GDT, also written as GDT_TS to represent "total score") measure.
© Laboratory of Theory of Biopolymers, Faculty of Chemistry, University of Warsaw 2013