Status: Done started: 2018-Nov-06 19:27:02 UTC
| Project Name | |
| Sequence | YEKIRTFAVA IVGVGGVGSV TAEMLTRCGI GKLLLFDYDK VELANMNRLF FQPHQAGLSK VQAAEHTLRN INPDVLFEVH NYNITTVENF QHFMDRISNG GLEEGKPVDL VLSCVDNFEA RMTINTACNE LGQTWMESGV SENAVSGHIQ LIIPGESACF ACAPPLVVAA NIDEKTLKRE GVCAASLPTT MGVVAGILVQ NVLKFLLNFG TVSFYLGYNA MQDFFPTMSM KPNPQCDDRN CRKQQEEYKK KVAALPKQEV IQEEEEIIHE DNEWGIELV |
| Secondary structure | CCCCCCCEEE EECCCHHHHH HHHHHHHHCC CEEEEECCCC CCCCCCCCCC CCCCCCCCCH HHHHHHHHHH HCCCCEEEEE CCCCCCHHHH HHHHHHHHHC CCCCCCCCCE EEECCCCHHH HHHHHHHHHH HCCCEEEEEE CCCCCEEEEE EECCCCCCCC CCCCCHHHHC CCCCCCCCCC CCCCCCHHHH HHHHHHHHHH HHHHHHHCCC CCCCEEEEEC CCCCCCEECC CCCCCCCCHH HHHHHHHHHH HHHCCCCCCC CCCCCCCCCC CCCCCCCCC |
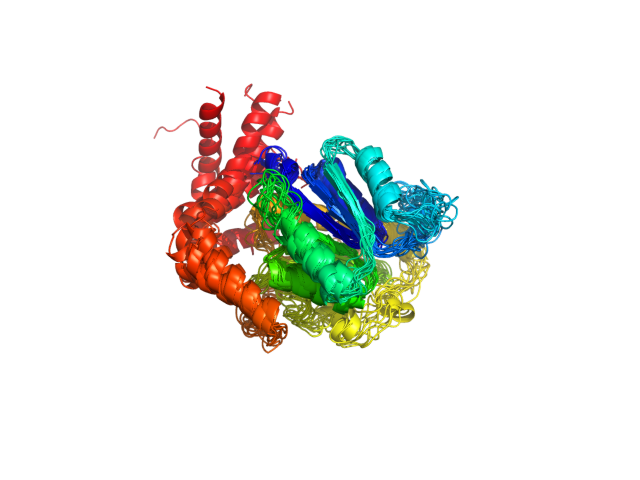
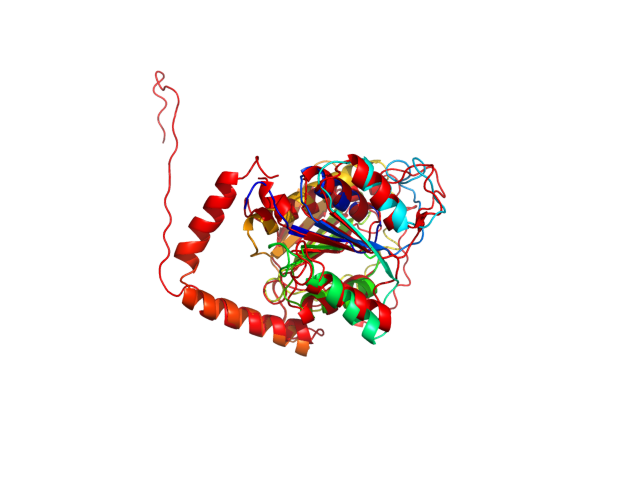
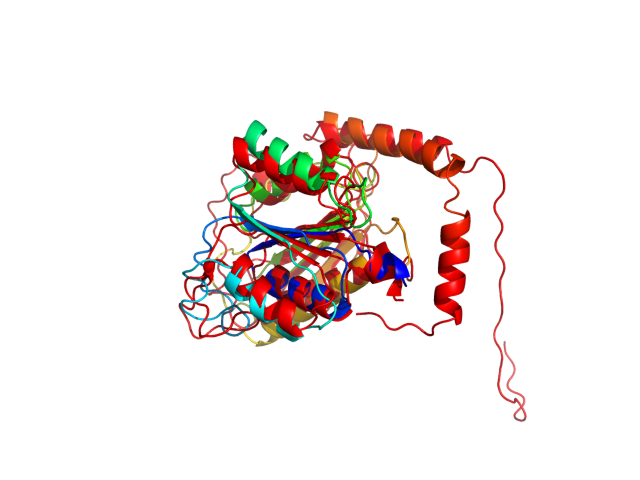
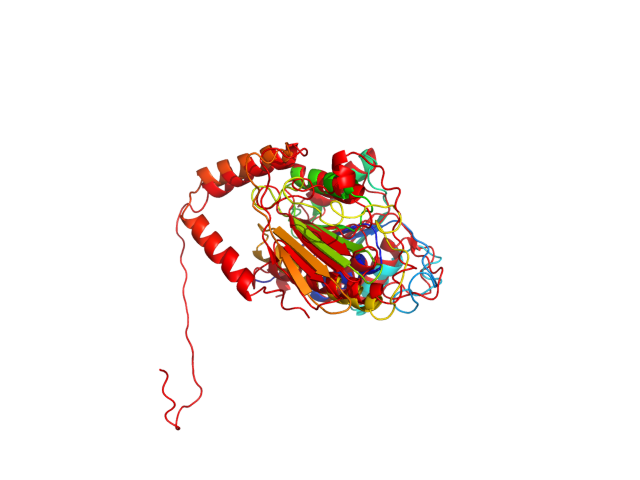
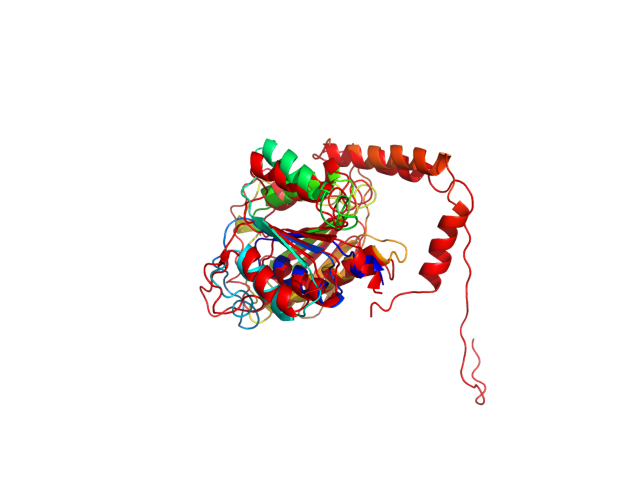
| Movie from predicted structures | To download the movie, right click on the desired file format:  
|
| Estimated finish time | 2018-Nov-06 23:22 UTC |
| Project Name |


| Project Name |
| Cluster # | 1 | 2 | 3 | 4 | 5 | 6 | 7 | 8 | 9 | 10 | 11 | 12 |
| Cluster density | 220.7 | 157.3 | 140.5 | 135.7 | 123.2 | 103.3 | 92.1 | 91.7 | 43.4 | 38.5 | 24.2 | 13.2 |
| Cluster size | 354 | 284 | 270 | 235 | 214 | 152 | 144 | 149 | 65 | 68 | 37 | 28 |
| Average cluster RMSD | 1.6 | 1.8 | 1.9 | 1.7 | 1.7 | 1.5 | 1.6 | 1.6 | 1.5 | 1.8 | 1.5 | 2.1 |
| # | 1 | 2 | 3 | 4 | 5 | 6 | 7 | 8 | 9 | 10 | 11 | 12 |
| RMSD | 7.81 | 7.09 | 7.66 | 6.89 | 6.98 | 6.74 | 7.63 | 6.48 | 7.01 | 6.90 | 7.41 | 4.91 |
| GDT_TS | 0.65 | 0.59 | 0.60 | 0.61 | 0.65 | 0.60 | 0.61 | 0.63 | 0.63 | 0.61 | 0.65 | 0.65 |
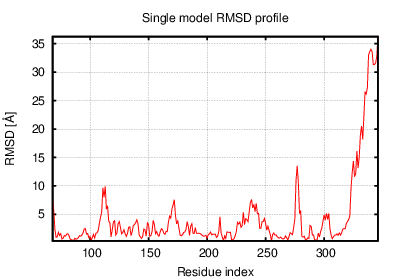
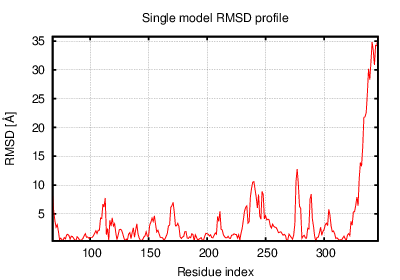
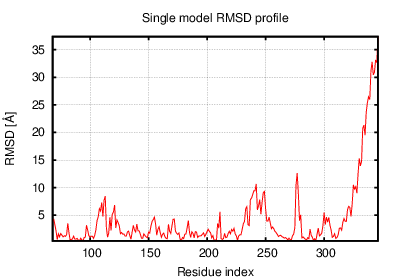
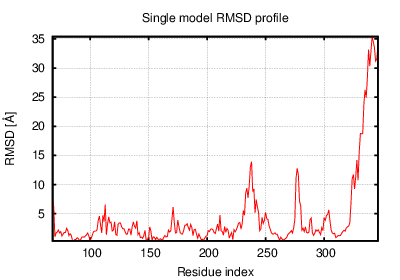
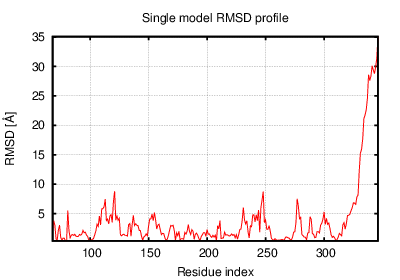
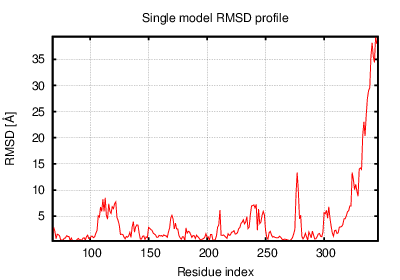
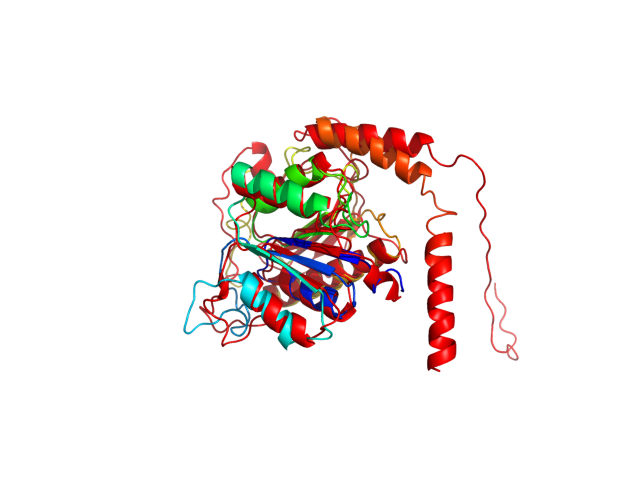
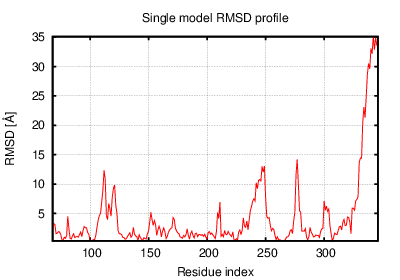
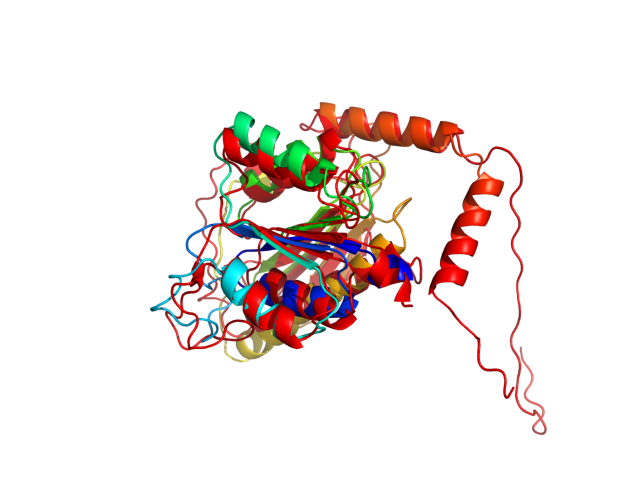
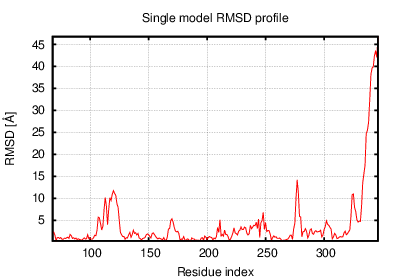
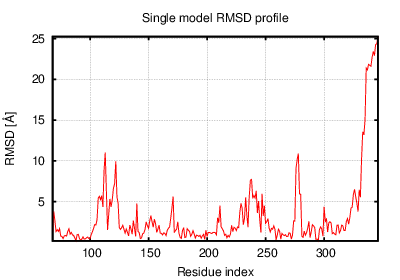
The table contains RMSD and GDT_TS values (calculated on the Cα atoms) between the predicted models and the input structure. Note that GDT_TS metric is intended as a more accurate measurement than the more common RMSD.
Read more about the root-mean-square deviation (RMSD) measure
Read more about the global distance test (GDT, also written as GDT_TS to represent "total score") measure.
| # | 1 | 2 | 3 | 4 | 5 | 6 | 7 | 8 | 9 | 10 | 11 | 12 |
| 1 | 0.00 | 4.05 | 2.29 | 5.91 | 4.20 | 5.05 | 2.49 | 4.51 | 6.49 | 6.26 | 7.87 | 7.62 |
| 2 | 4.05 | 0.00 | 3.95 | 3.49 | 2.67 | 2.51 | 4.04 | 3.48 | 4.14 | 4.00 | 5.98 | 6.27 |
| 3 | 2.29 | 3.95 | 0.00 | 5.66 | 3.87 | 4.81 | 2.27 | 4.22 | 6.16 | 5.85 | 7.52 | 7.43 |
| 4 | 5.91 | 3.49 | 5.66 | 0.00 | 3.42 | 3.10 | 5.63 | 4.44 | 3.01 | 2.71 | 4.93 | 5.27 |
| 5 | 4.20 | 2.67 | 3.87 | 3.42 | 0.00 | 2.84 | 3.92 | 2.80 | 4.02 | 4.04 | 5.35 | 5.80 |
| 6 | 5.05 | 2.51 | 4.81 | 3.10 | 2.84 | 0.00 | 4.86 | 3.32 | 3.74 | 3.58 | 5.44 | 5.70 |
| 7 | 2.49 | 4.04 | 2.27 | 5.63 | 3.92 | 4.86 | 0.00 | 4.21 | 6.35 | 5.99 | 7.57 | 7.43 |
| 8 | 4.51 | 3.48 | 4.22 | 4.44 | 2.80 | 3.32 | 4.21 | 0.00 | 4.88 | 4.48 | 5.84 | 5.76 |
| 9 | 6.49 | 4.14 | 6.16 | 3.01 | 4.02 | 3.74 | 6.35 | 4.88 | 0.00 | 3.14 | 3.63 | 4.73 |
| 10 | 6.26 | 4.00 | 5.85 | 2.71 | 4.04 | 3.58 | 5.99 | 4.48 | 3.14 | 0.00 | 4.61 | 4.63 |
| 11 | 7.87 | 5.98 | 7.52 | 4.93 | 5.35 | 5.44 | 7.57 | 5.84 | 3.63 | 4.61 | 0.00 | 4.43 |
| 12 | 7.62 | 6.27 | 7.43 | 5.27 | 5.80 | 5.70 | 7.43 | 5.76 | 4.73 | 4.63 | 4.43 | 0.00 |
The table contains RMSD values (calculated on the Cα atoms) between the predicted models.
Read more about the root-mean-square deviation (RMSD) measure.
| # | 1 | 2 | 3 | 4 | 5 | 6 | 7 | 8 | 9 | 10 | 11 | 12 |
| 1 | 1.00 | 0.70 | 0.73 | 0.64 | 0.70 | 0.67 | 0.71 | 0.64 | 0.66 | 0.64 | 0.66 | 0.64 |
| 2 | 0.70 | 1.00 | 0.66 | 0.64 | 0.70 | 0.71 | 0.65 | 0.67 | 0.64 | 0.66 | 0.60 | 0.59 |
| 3 | 0.73 | 0.66 | 1.00 | 0.58 | 0.67 | 0.61 | 0.76 | 0.65 | 0.62 | 0.61 | 0.59 | 0.59 |
| 4 | 0.64 | 0.64 | 0.58 | 1.00 | 0.68 | 0.71 | 0.58 | 0.64 | 0.70 | 0.71 | 0.64 | 0.65 |
| 5 | 0.70 | 0.70 | 0.67 | 0.68 | 1.00 | 0.69 | 0.66 | 0.70 | 0.66 | 0.66 | 0.65 | 0.65 |
| 6 | 0.67 | 0.71 | 0.61 | 0.71 | 0.69 | 1.00 | 0.62 | 0.69 | 0.67 | 0.74 | 0.64 | 0.65 |
| 7 | 0.71 | 0.65 | 0.76 | 0.58 | 0.66 | 0.62 | 1.00 | 0.62 | 0.59 | 0.60 | 0.60 | 0.56 |
| 8 | 0.64 | 0.67 | 0.65 | 0.64 | 0.70 | 0.69 | 0.62 | 1.00 | 0.61 | 0.65 | 0.61 | 0.63 |
| 9 | 0.66 | 0.64 | 0.62 | 0.70 | 0.66 | 0.67 | 0.59 | 0.61 | 1.00 | 0.67 | 0.72 | 0.70 |
| 10 | 0.64 | 0.66 | 0.61 | 0.71 | 0.66 | 0.74 | 0.60 | 0.65 | 0.67 | 1.00 | 0.62 | 0.64 |
| 11 | 0.66 | 0.60 | 0.59 | 0.64 | 0.65 | 0.64 | 0.60 | 0.61 | 0.72 | 0.62 | 1.00 | 0.70 |
| 12 | 0.64 | 0.59 | 0.59 | 0.65 | 0.65 | 0.65 | 0.56 | 0.63 | 0.70 | 0.64 | 0.70 | 1.00 |
The table contains GDT_TS values (calculated on the Cα atoms) between the predicted models.
Read more about the global distance test (GDT, also written as GDT_TS to represent "total score") measure.
© Laboratory of Theory of Biopolymers, Faculty of Chemistry, University of Warsaw 2013