Status: Done started: 2018-Aug-08 00:17:17 UTC
| Project Name | |
| Sequence | GSSKYGDTST NNVRGDLQVL AKKAERALPG GGDCKYGESR TTNVRGDLQV LAQKAATTLP GGGNCKYAGG SLTNVRGDLQ VLDQKAARPL PPRQQDKGIA IPHDIDLGES RVVIQDYDNQ HEQDRPTPSP APSRPFSVLR ANDVLWLSLT AAEYDQTTYG SSTNPMYVSD TVTFVNVATC AQGVSRSLDW SKVTLDGRPL TTIQQYSKTF YVLPLRGKLS FWEAGTTKAG YPYNYNTTAS DQILIENAAG HRVCISTYTT NLGSGPVSIS AVGVLAPHSA LAVLEDTVDY PARAHTFDDF CPECRALGLQ G |
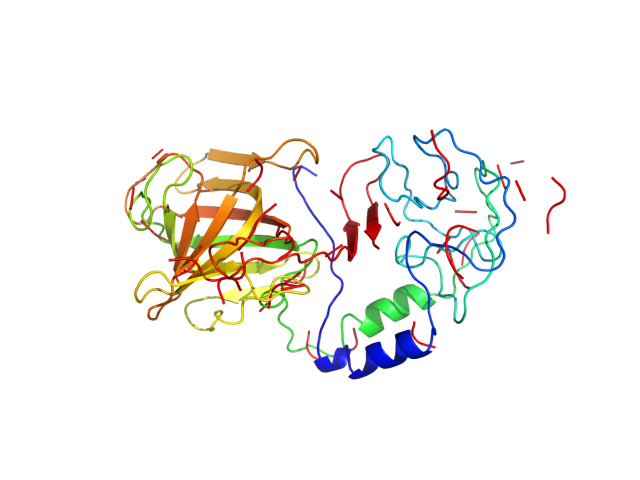
| Secondary structure | CCCCCCCCCC CCCCCHHHHH HHHHHCCCCC CCCCCCCCCC CCCCCCCCCC CCCCCCCCCC CCCCCCCCCC CCCCCCCCCC CCCCCCCCCC CCCCCCCCCC CCCCCCCCCC CCCCCCCCCC CCCCCCCCCC CCCCCCCEEC CCCEEEEECC CCCCCCCCCC CCCCCCCCCC CCEEEECCCC CEEECCCCCC CCCEECCEEC EEECCCCCCE EEEEECCCCE ECCCCCCCCC CCCCCCCCCC EEEEEECCCC CCEECCCCCC CCCCCCCCCE EEEECCCCCC CCCCCCCCCC CCCCCCCCCC CCCCCCCCCC C |
| Movie from predicted structures | To download the movie, right click on the desired file format:  
|
| Estimated finish time | 2018-Aug-08 05:17 UTC |
| Project Name |
| Project Name |
| Cluster # | 1 | 2 | 3 | 4 | 5 | 6 | 7 | 8 | 9 | 10 | 11 | 12 |
| Cluster density | 149.9 | 114.6 | 94.9 | 93.3 | 92.7 | 75.8 | 75.7 | 65.7 | 58.5 | 58.5 | 51.1 | 50.8 |
| Cluster size | 300 | 260 | 189 | 187 | 201 | 137 | 160 | 139 | 112 | 117 | 102 | 96 |
| Average cluster RMSD | 2.0 | 2.3 | 2.0 | 2.0 | 2.2 | 1.8 | 2.1 | 2.1 | 1.9 | 2.0 | 2.0 | 1.9 |
| # | 1 | 2 | 3 | 4 | 5 | 6 | 7 | 8 | 9 | 10 | 11 | 12 |
| RMSD | 4.82 | 3.38 | 5.48 | 4.44 | 3.91 | 5.10 | 4.20 | 4.66 | 6.65 | 4.71 | 4.13 | 6.26 |
| GDT_TS | 0.50 | 0.57 | 0.47 | 0.53 | 0.56 | 0.49 | 0.52 | 0.51 | 0.43 | 0.52 | 0.53 | 0.44 |
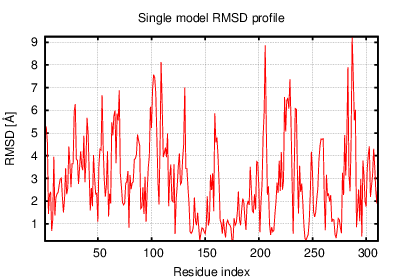
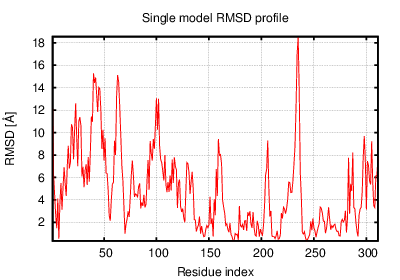
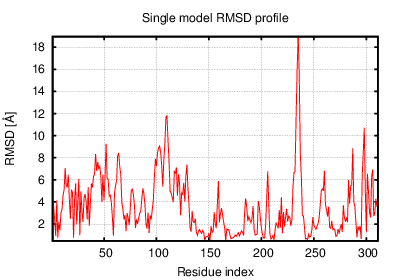
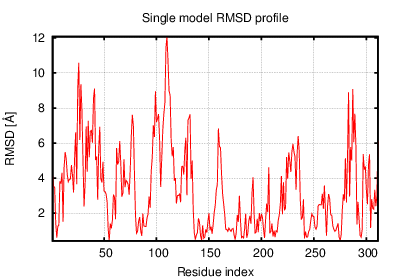
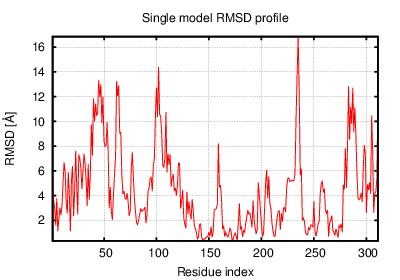
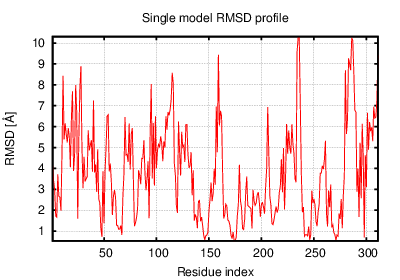
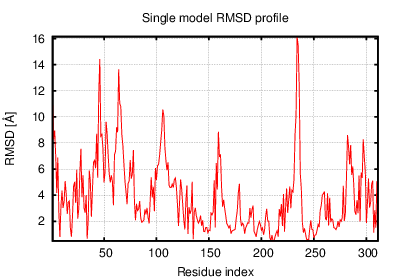
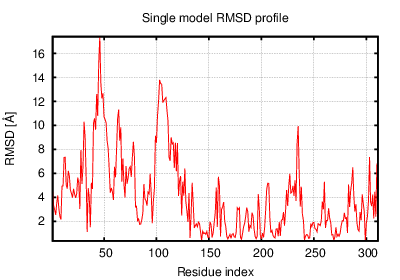
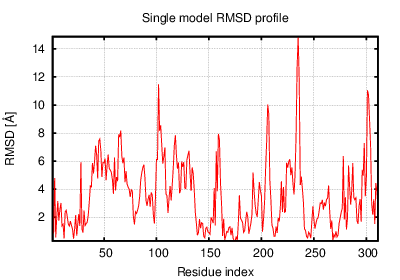
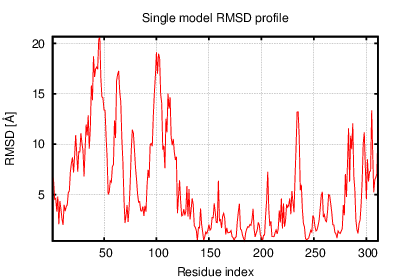
The table contains RMSD and GDT_TS values (calculated on the Cα atoms) between the predicted models and the input structure. Note that GDT_TS metric is intended as a more accurate measurement than the more common RMSD.
Read more about the root-mean-square deviation (RMSD) measure
Read more about the global distance test (GDT, also written as GDT_TS to represent "total score") measure.
| # | 1 | 2 | 3 | 4 | 5 | 6 | 7 | 8 | 9 | 10 | 11 | 12 |
| 1 | 0.00 | 4.32 | 3.80 | 3.09 | 4.60 | 3.21 | 3.85 | 4.51 | 4.58 | 4.92 | 3.50 | 4.11 |
| 2 | 4.32 | 0.00 | 5.40 | 4.32 | 3.92 | 4.83 | 3.42 | 4.84 | 6.38 | 4.96 | 3.72 | 6.07 |
| 3 | 3.80 | 5.40 | 0.00 | 3.62 | 4.86 | 3.55 | 4.68 | 5.17 | 3.68 | 5.89 | 4.47 | 3.54 |
| 4 | 3.09 | 4.32 | 3.62 | 0.00 | 4.50 | 3.12 | 3.92 | 4.35 | 4.92 | 4.99 | 3.44 | 4.00 |
| 5 | 4.60 | 3.92 | 4.86 | 4.50 | 0.00 | 4.32 | 4.34 | 4.81 | 5.77 | 4.15 | 4.85 | 5.33 |
| 6 | 3.21 | 4.83 | 3.55 | 3.12 | 4.32 | 0.00 | 4.27 | 5.22 | 4.32 | 5.39 | 4.37 | 3.74 |
| 7 | 3.85 | 3.42 | 4.68 | 3.92 | 4.34 | 4.27 | 0.00 | 4.98 | 5.60 | 5.50 | 3.98 | 5.35 |
| 8 | 4.51 | 4.84 | 5.17 | 4.35 | 4.81 | 5.22 | 4.98 | 0.00 | 6.33 | 3.78 | 4.27 | 5.47 |
| 9 | 4.58 | 6.38 | 3.68 | 4.92 | 5.77 | 4.32 | 5.60 | 6.33 | 0.00 | 6.53 | 6.06 | 3.43 |
| 10 | 4.92 | 4.96 | 5.89 | 4.99 | 4.15 | 5.39 | 5.50 | 3.78 | 6.53 | 0.00 | 5.07 | 5.72 |
| 11 | 3.50 | 3.72 | 4.47 | 3.44 | 4.85 | 4.37 | 3.98 | 4.27 | 6.06 | 5.07 | 0.00 | 5.43 |
| 12 | 4.11 | 6.07 | 3.54 | 4.00 | 5.33 | 3.74 | 5.35 | 5.47 | 3.43 | 5.72 | 5.43 | 0.00 |
The table contains RMSD values (calculated on the Cα atoms) between the predicted models.
Read more about the root-mean-square deviation (RMSD) measure.
| # | 1 | 2 | 3 | 4 | 5 | 6 | 7 | 8 | 9 | 10 | 11 | 12 |
| 1 | 1.00 | 0.55 | 0.56 | 0.62 | 0.53 | 0.60 | 0.57 | 0.52 | 0.52 | 0.51 | 0.58 | 0.55 |
| 2 | 0.55 | 1.00 | 0.51 | 0.57 | 0.57 | 0.54 | 0.59 | 0.51 | 0.48 | 0.51 | 0.59 | 0.49 |
| 3 | 0.56 | 0.51 | 1.00 | 0.57 | 0.51 | 0.56 | 0.52 | 0.51 | 0.56 | 0.46 | 0.52 | 0.58 |
| 4 | 0.62 | 0.57 | 0.57 | 1.00 | 0.52 | 0.62 | 0.56 | 0.53 | 0.52 | 0.49 | 0.58 | 0.56 |
| 5 | 0.53 | 0.57 | 0.51 | 0.52 | 1.00 | 0.53 | 0.55 | 0.53 | 0.46 | 0.55 | 0.50 | 0.49 |
| 6 | 0.60 | 0.54 | 0.56 | 0.62 | 0.53 | 1.00 | 0.54 | 0.49 | 0.54 | 0.49 | 0.53 | 0.56 |
| 7 | 0.57 | 0.59 | 0.52 | 0.56 | 0.55 | 0.54 | 1.00 | 0.51 | 0.51 | 0.48 | 0.53 | 0.52 |
| 8 | 0.52 | 0.51 | 0.51 | 0.53 | 0.53 | 0.49 | 0.51 | 1.00 | 0.45 | 0.58 | 0.54 | 0.50 |
| 9 | 0.52 | 0.48 | 0.56 | 0.52 | 0.46 | 0.54 | 0.51 | 0.45 | 1.00 | 0.44 | 0.47 | 0.61 |
| 10 | 0.51 | 0.51 | 0.46 | 0.49 | 0.55 | 0.49 | 0.48 | 0.58 | 0.44 | 1.00 | 0.50 | 0.47 |
| 11 | 0.58 | 0.59 | 0.52 | 0.58 | 0.50 | 0.53 | 0.53 | 0.54 | 0.47 | 0.50 | 1.00 | 0.49 |
| 12 | 0.55 | 0.49 | 0.58 | 0.56 | 0.49 | 0.56 | 0.52 | 0.50 | 0.61 | 0.47 | 0.49 | 1.00 |
The table contains GDT_TS values (calculated on the Cα atoms) between the predicted models.
Read more about the global distance test (GDT, also written as GDT_TS to represent "total score") measure.
© Laboratory of Theory of Biopolymers, Faculty of Chemistry, University of Warsaw 2013