Status: Done started: 2018-Aug-12 08:14:54 UTC
| Project Name | |
| Sequence | MNKAKRLEIL TRLRENNPHP TTELNFSSPF ELLIAVLLSA QATDVSVNKA TAKLYPVANT PAAMLELGVE GVKTYIKTIG LYNSKAENII KTCRILLEQH NGEVPEDRAA LEALPGVGRK TANVVLNTAF GWPTIAVDTH IFRVCNRTQF APGKNVEQVE EKLLKVVPAE FKVDCHHWLI LHGRYTCIAR KPRCGSCIIE DLCEYKEKVD I |
| Secondary structure | CCHHHHHHHH HHHHHHCCCC CCCCCCCCHH HHHHHHHHCC CCCHHHHHHH HHHHCCCCCC HHHHHHHHHH HHHHHHCCCC CHHHHHHHHH HHHHHHHHHC CCCCCCCHHH HHHCCCCCHH HHHHHHHHHH CCCCCCCCHH HHHHHHHHCC CCCCCHHHHH HHHHHHCCCC CCCCHHHHHH HHHHHCCCCC CCCCCCCCCC CCCCCCCCCC C |
| Movie from predicted structures | To download the movie, right click on the desired file format:  
|
| Estimated finish time | 2018-Aug-12 13:01 UTC |
| Project Name |

| Project Name |
| Cluster # | 1 | 2 | 3 | 4 | 5 | 6 | 7 | 8 | 9 | 10 | 11 | 12 |
| Cluster density | 191.5 | 182.9 | 148.6 | 143.3 | 137.5 | 137.1 | 136.1 | 132.8 | 131.6 | 107.8 | 78.1 | 67.6 |
| Cluster size | 228 | 225 | 199 | 171 | 177 | 155 | 165 | 198 | 157 | 141 | 98 | 86 |
| Average cluster RMSD | 1.2 | 1.2 | 1.3 | 1.2 | 1.3 | 1.1 | 1.2 | 1.5 | 1.2 | 1.3 | 1.3 | 1.3 |
| # | 1 | 2 | 3 | 4 | 5 | 6 | 7 | 8 | 9 | 10 | 11 | 12 |
| RMSD | 2.63 | 3.36 | 3.45 | 3.55 | 3.20 | 2.56 | 2.39 | 2.43 | 2.67 | 2.57 | 3.16 | 3.05 |
| GDT_TS | 0.64 | 0.54 | 0.55 | 0.54 | 0.60 | 0.64 | 0.67 | 0.68 | 0.62 | 0.66 | 0.57 | 0.60 |
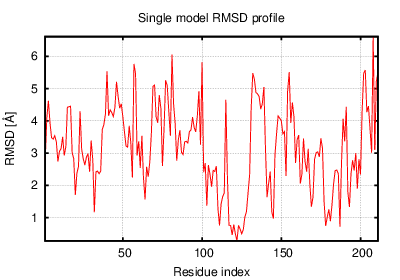
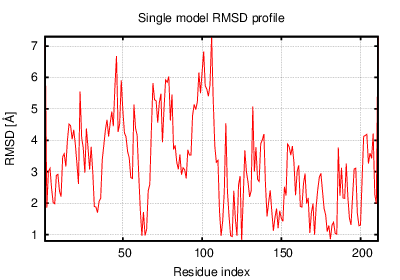
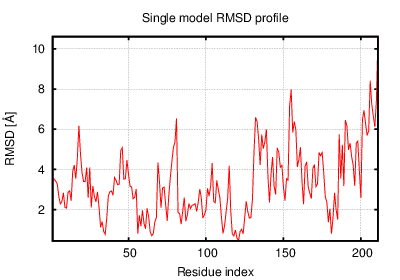
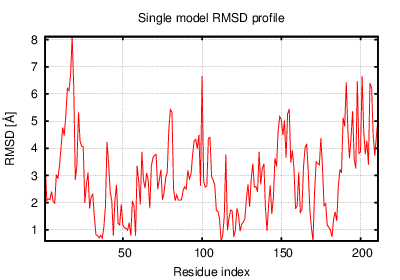
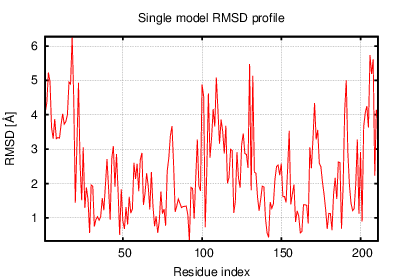
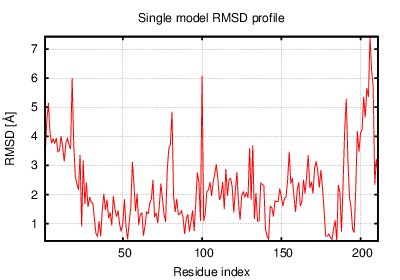
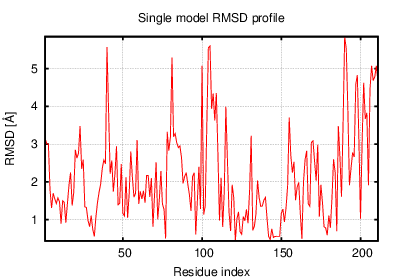
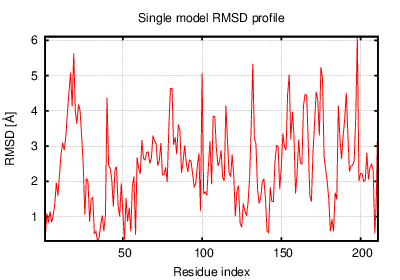
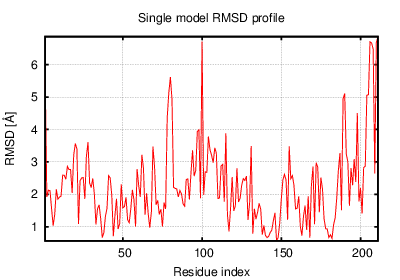
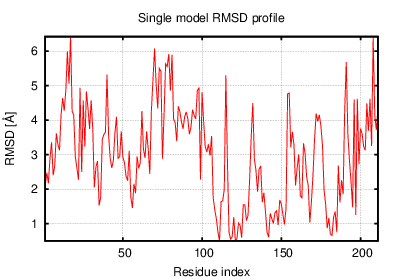
The table contains RMSD and GDT_TS values (calculated on the Cα atoms) between the predicted models and the input structure. Note that GDT_TS metric is intended as a more accurate measurement than the more common RMSD.
Read more about the root-mean-square deviation (RMSD) measure
Read more about the global distance test (GDT, also written as GDT_TS to represent "total score") measure.
| # | 1 | 2 | 3 | 4 | 5 | 6 | 7 | 8 | 9 | 10 | 11 | 12 |
| 1 | 0.00 | 2.86 | 2.90 | 2.96 | 2.33 | 2.26 | 2.05 | 2.38 | 2.14 | 2.14 | 2.42 | 2.25 |
| 2 | 2.86 | 0.00 | 2.27 | 1.99 | 2.44 | 2.70 | 2.70 | 2.91 | 2.57 | 3.00 | 2.15 | 2.40 |
| 3 | 2.90 | 2.27 | 0.00 | 2.25 | 2.49 | 3.10 | 3.04 | 3.09 | 2.72 | 3.18 | 2.09 | 2.29 |
| 4 | 2.96 | 1.99 | 2.25 | 0.00 | 2.43 | 3.14 | 2.94 | 3.03 | 2.79 | 3.36 | 2.28 | 2.46 |
| 5 | 2.33 | 2.44 | 2.49 | 2.43 | 0.00 | 2.68 | 2.48 | 2.80 | 1.89 | 2.64 | 1.97 | 1.75 |
| 6 | 2.26 | 2.70 | 3.10 | 3.14 | 2.68 | 0.00 | 1.65 | 2.29 | 2.36 | 2.28 | 2.49 | 2.49 |
| 7 | 2.05 | 2.70 | 3.04 | 2.94 | 2.48 | 1.65 | 0.00 | 2.17 | 2.29 | 1.89 | 2.53 | 2.48 |
| 8 | 2.38 | 2.91 | 3.09 | 3.03 | 2.80 | 2.29 | 2.17 | 0.00 | 2.45 | 2.65 | 2.83 | 2.56 |
| 9 | 2.14 | 2.57 | 2.72 | 2.79 | 1.89 | 2.36 | 2.29 | 2.45 | 0.00 | 2.50 | 2.08 | 2.04 |
| 10 | 2.14 | 3.00 | 3.18 | 3.36 | 2.64 | 2.28 | 1.89 | 2.65 | 2.50 | 0.00 | 2.69 | 2.75 |
| 11 | 2.42 | 2.15 | 2.09 | 2.28 | 1.97 | 2.49 | 2.53 | 2.83 | 2.08 | 2.69 | 0.00 | 1.72 |
| 12 | 2.25 | 2.40 | 2.29 | 2.46 | 1.75 | 2.49 | 2.48 | 2.56 | 2.04 | 2.75 | 1.72 | 0.00 |
The table contains RMSD values (calculated on the Cα atoms) between the predicted models.
Read more about the root-mean-square deviation (RMSD) measure.
| # | 1 | 2 | 3 | 4 | 5 | 6 | 7 | 8 | 9 | 10 | 11 | 12 |
| 1 | 1.00 | 0.64 | 0.62 | 0.64 | 0.71 | 0.69 | 0.70 | 0.67 | 0.72 | 0.74 | 0.68 | 0.73 |
| 2 | 0.64 | 1.00 | 0.73 | 0.75 | 0.68 | 0.62 | 0.65 | 0.60 | 0.66 | 0.62 | 0.74 | 0.69 |
| 3 | 0.62 | 0.73 | 1.00 | 0.69 | 0.67 | 0.61 | 0.61 | 0.60 | 0.62 | 0.59 | 0.73 | 0.72 |
| 4 | 0.64 | 0.75 | 0.69 | 1.00 | 0.68 | 0.59 | 0.61 | 0.60 | 0.64 | 0.60 | 0.70 | 0.68 |
| 5 | 0.71 | 0.68 | 0.67 | 0.68 | 1.00 | 0.64 | 0.66 | 0.61 | 0.77 | 0.68 | 0.76 | 0.78 |
| 6 | 0.69 | 0.62 | 0.61 | 0.59 | 0.64 | 1.00 | 0.79 | 0.69 | 0.68 | 0.72 | 0.65 | 0.66 |
| 7 | 0.70 | 0.65 | 0.61 | 0.61 | 0.66 | 0.79 | 1.00 | 0.70 | 0.67 | 0.77 | 0.65 | 0.66 |
| 8 | 0.67 | 0.60 | 0.60 | 0.60 | 0.61 | 0.69 | 0.70 | 1.00 | 0.65 | 0.66 | 0.62 | 0.65 |
| 9 | 0.72 | 0.66 | 0.62 | 0.64 | 0.77 | 0.68 | 0.67 | 0.65 | 1.00 | 0.70 | 0.72 | 0.76 |
| 10 | 0.74 | 0.62 | 0.59 | 0.60 | 0.68 | 0.72 | 0.77 | 0.66 | 0.70 | 1.00 | 0.65 | 0.69 |
| 11 | 0.68 | 0.74 | 0.73 | 0.70 | 0.76 | 0.65 | 0.65 | 0.62 | 0.72 | 0.65 | 1.00 | 0.81 |
| 12 | 0.73 | 0.69 | 0.72 | 0.68 | 0.78 | 0.66 | 0.66 | 0.65 | 0.76 | 0.69 | 0.81 | 1.00 |
The table contains GDT_TS values (calculated on the Cα atoms) between the predicted models.
Read more about the global distance test (GDT, also written as GDT_TS to represent "total score") measure.
© Laboratory of Theory of Biopolymers, Faculty of Chemistry, University of Warsaw 2013