Status: Done started: 2018-Jul-28 16:49:29 UTC
| Project Name | |
| Sequence | APPHALSEAA AKLLYGGIFC YAAYKIYANW PTYAAYHVYT THFAYAAYRV AAALRIYAAY ATYAALLPLA AYFVKWNFTA FAAYYVAFVE RLYAAYFVAY FRTPLAAYFM HVYTTHFGPG PGTFVKWNFT AFLVDKDGPG PGAPLMLYIS KMVPTADGPG PGNTDFVMYV ASVPSEGGPG PGTTFVKWNF TAFLVDKGPG PGCNGGLMLQ AFEWLLRGPG PGWLKGYFRL GVAMESMGPG PGLGTTFVKW NFTAFLVGPG PGAAYYIKAA ERIAAKGGPG PGASDAGYYS ALTMAIFGPG PGLVKYLIPQ ALQLHTEGPG PGLTKLFRYK SSRSESEGPG PGQDCKFVLV KAAAPAAGPG PGDILVKYLI PQALQLHGPG PGSDAGYYSA LTMAIFQ |
| Secondary structure | CCCHHHHHHH HHHHHCHHHH CCHHHHHCCC CCCCCCCCCC CCCCCCCCCC CCCHHHHHCC CCCCCCCCCC CCCCCCCCCC CHHHHHHHHC CHHHHHHCCC CCCHHHHHHC CHHHHHCCCC CCEEEECCEE EECCCCCCCC CCCCCCCCCC EEEEEEEEEC CCCEEEEEEE ECCCCCCCCC CCCCCCCCCC CCCCCCCCCC CCCCCCCCHH HHHHHCCCCC CCHHHHHHHC HHHHHHCCCC CCCCCCCCCC CCCCCCCCCC CCCCCCCCCC CCCCCCCCCC CCCCEECCCC CCCEECCCCC CCCCCEECCC CCCHHHHCCC CCCCCCCCCC CCCEECCCCC CCCCCCCCCC CCCCCCCCCC CCCCCHHHHH HHHHHHHCCC CCCHHHHHHH HHHHHHC |
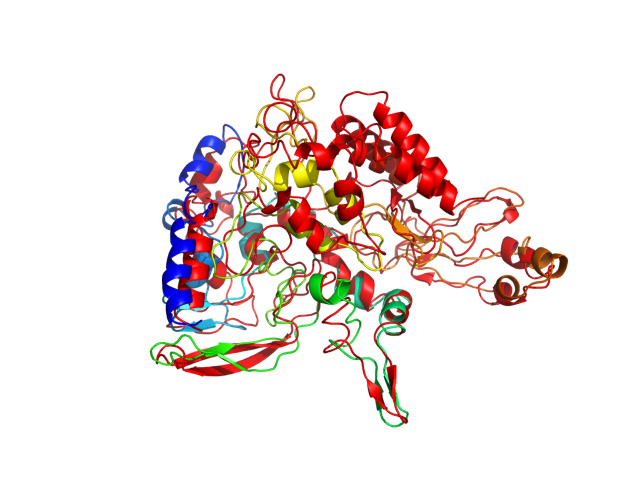
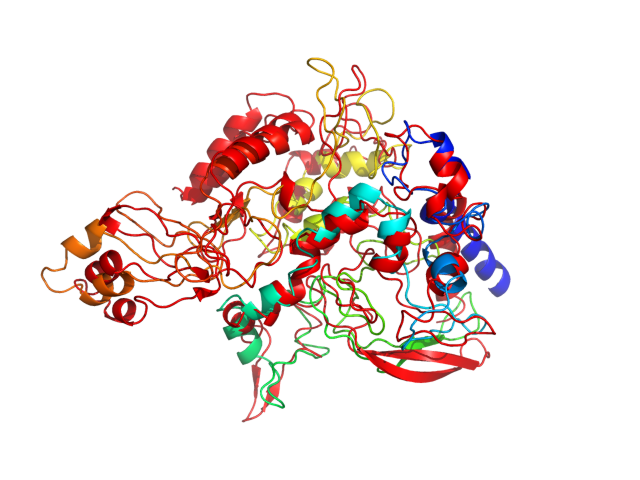
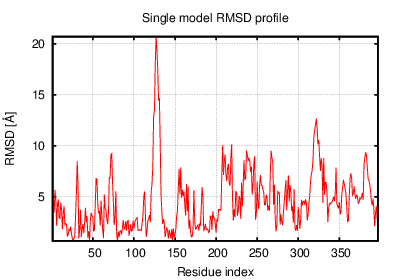
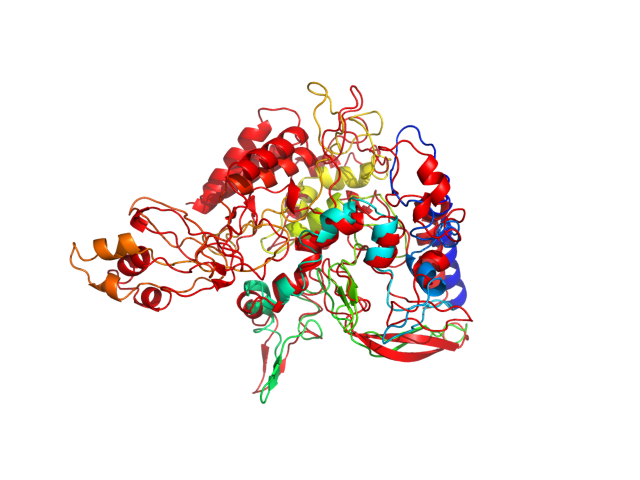
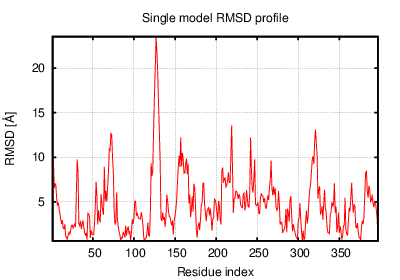
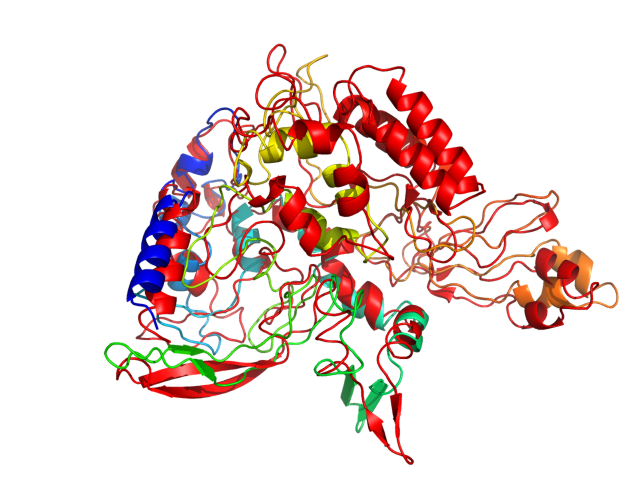
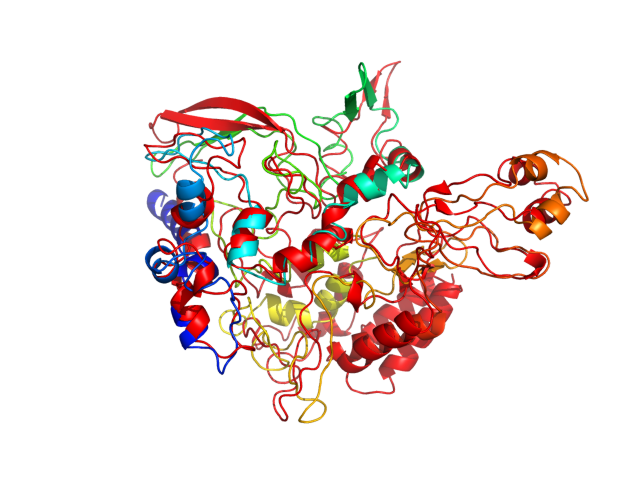
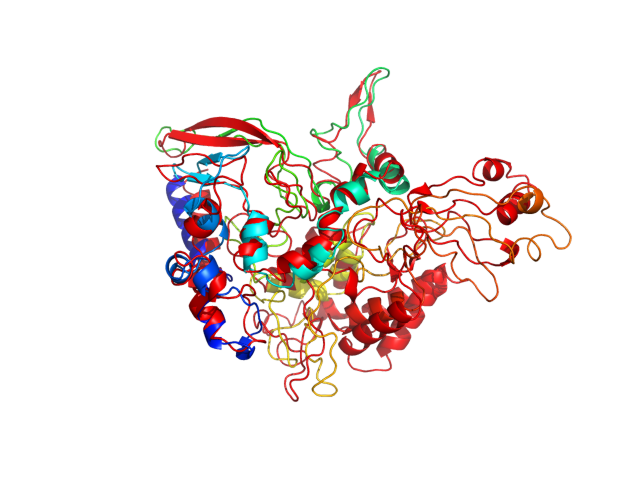
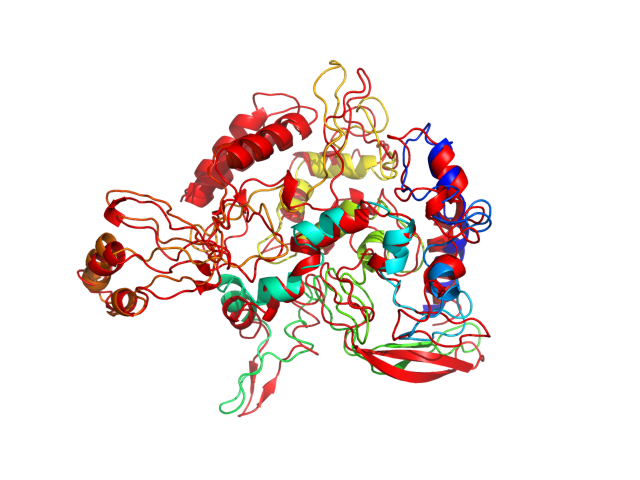
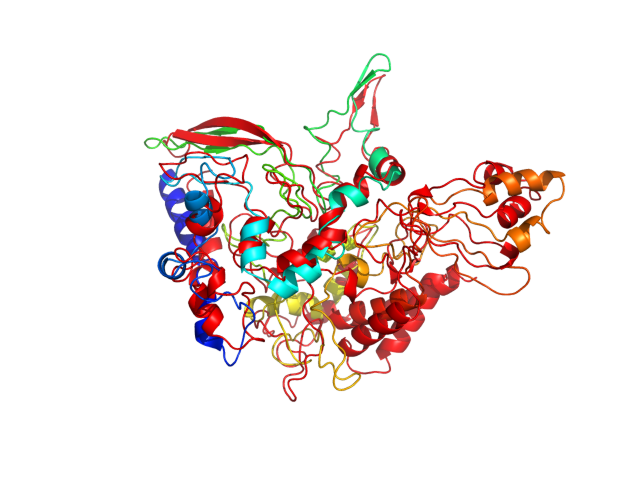
| Movie from predicted structures | To download the movie, right click on the desired file format:  
|
| Estimated finish time | 2018-Jul-28 22:00 UTC |
| Project Name |


| Project Name |
| Cluster # | 1 | 2 | 3 | 4 | 5 | 6 | 7 | 8 | 9 | 10 | 11 | 12 |
| Cluster density | 152.8 | 135.1 | 133.5 | 123.8 | 123.1 | 118.0 | 108.0 | 92.3 | 85.6 | 80.9 | 60.9 | 60.3 |
| Cluster size | 245 | 220 | 217 | 203 | 200 | 186 | 161 | 149 | 130 | 112 | 91 | 86 |
| Average cluster RMSD | 1.6 | 1.6 | 1.6 | 1.6 | 1.6 | 1.6 | 1.5 | 1.6 | 1.5 | 1.4 | 1.5 | 1.4 |
| # | 1 | 2 | 3 | 4 | 5 | 6 | 7 | 8 | 9 | 10 | 11 | 12 |
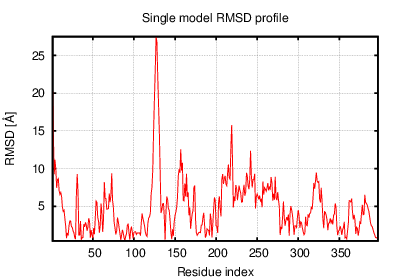
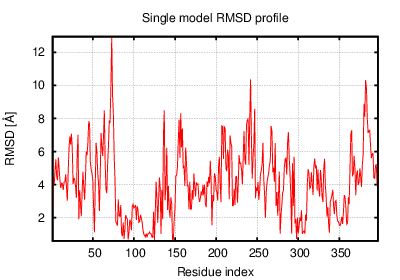
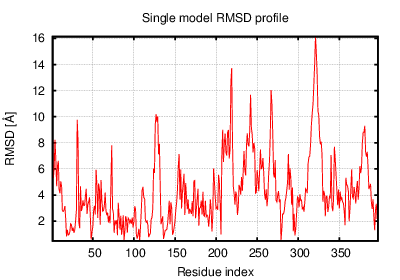
| RMSD | 5.49 | 5.87 | 4.45 | 4.91 | 4.84 | 5.36 | 5.34 | 5.52 | 5.91 | 5.10 | 3.92 | 5.19 |
| GDT_TS | 0.42 | 0.45 | 0.44 | 0.43 | 0.44 | 0.45 | 0.43 | 0.42 | 0.41 | 0.43 | 0.52 | 0.41 |
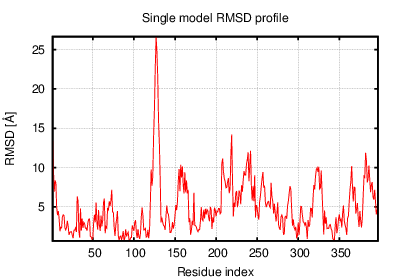
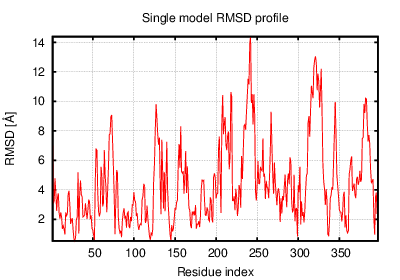
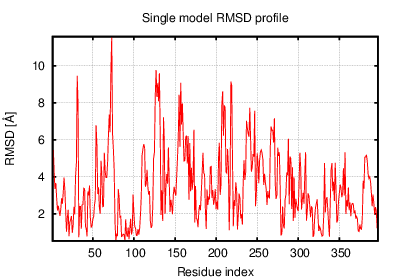
The table contains RMSD and GDT_TS values (calculated on the Cα atoms) between the predicted models and the input structure. Note that GDT_TS metric is intended as a more accurate measurement than the more common RMSD.
Read more about the root-mean-square deviation (RMSD) measure
Read more about the global distance test (GDT, also written as GDT_TS to represent "total score") measure.
| # | 1 | 2 | 3 | 4 | 5 | 6 | 7 | 8 | 9 | 10 | 11 | 12 |
| 1 | 0.00 | 3.54 | 4.20 | 3.55 | 4.20 | 2.89 | 2.66 | 3.34 | 3.64 | 3.50 | 4.00 | 3.80 |
| 2 | 3.54 | 0.00 | 4.98 | 4.28 | 5.10 | 3.10 | 3.70 | 3.39 | 3.46 | 4.49 | 4.77 | 4.56 |
| 3 | 4.20 | 4.98 | 0.00 | 3.87 | 3.55 | 4.45 | 4.21 | 4.45 | 4.97 | 3.75 | 3.19 | 3.83 |
| 4 | 3.55 | 4.28 | 3.87 | 0.00 | 2.98 | 3.79 | 3.07 | 4.04 | 4.47 | 2.82 | 3.98 | 3.04 |
| 5 | 4.20 | 5.10 | 3.55 | 2.98 | 0.00 | 4.50 | 3.89 | 4.57 | 5.06 | 2.85 | 4.17 | 3.06 |
| 6 | 2.89 | 3.10 | 4.45 | 3.79 | 4.50 | 0.00 | 3.18 | 3.33 | 3.49 | 3.93 | 4.11 | 4.08 |
| 7 | 2.66 | 3.70 | 4.21 | 3.07 | 3.89 | 3.18 | 0.00 | 3.52 | 3.86 | 3.33 | 3.97 | 3.35 |
| 8 | 3.34 | 3.39 | 4.45 | 4.04 | 4.57 | 3.33 | 3.52 | 0.00 | 3.23 | 4.01 | 4.07 | 4.24 |
| 9 | 3.64 | 3.46 | 4.97 | 4.47 | 5.06 | 3.49 | 3.86 | 3.23 | 0.00 | 4.47 | 4.33 | 4.48 |
| 10 | 3.50 | 4.49 | 3.75 | 2.82 | 2.85 | 3.93 | 3.33 | 4.01 | 4.47 | 0.00 | 3.96 | 3.11 |
| 11 | 4.00 | 4.77 | 3.19 | 3.98 | 4.17 | 4.11 | 3.97 | 4.07 | 4.33 | 3.96 | 0.00 | 4.16 |
| 12 | 3.80 | 4.56 | 3.83 | 3.04 | 3.06 | 4.08 | 3.35 | 4.24 | 4.48 | 3.11 | 4.16 | 0.00 |
The table contains RMSD values (calculated on the Cα atoms) between the predicted models.
Read more about the root-mean-square deviation (RMSD) measure.
| # | 1 | 2 | 3 | 4 | 5 | 6 | 7 | 8 | 9 | 10 | 11 | 12 |
| 1 | 1.00 | 0.56 | 0.59 | 0.58 | 0.56 | 0.61 | 0.62 | 0.55 | 0.52 | 0.59 | 0.56 | 0.55 |
| 2 | 0.56 | 1.00 | 0.53 | 0.54 | 0.49 | 0.60 | 0.53 | 0.60 | 0.58 | 0.52 | 0.53 | 0.51 |
| 3 | 0.59 | 0.53 | 1.00 | 0.57 | 0.58 | 0.53 | 0.56 | 0.53 | 0.52 | 0.56 | 0.59 | 0.55 |
| 4 | 0.58 | 0.54 | 0.57 | 1.00 | 0.61 | 0.56 | 0.60 | 0.51 | 0.49 | 0.62 | 0.57 | 0.58 |
| 5 | 0.56 | 0.49 | 0.58 | 0.61 | 1.00 | 0.53 | 0.55 | 0.50 | 0.49 | 0.63 | 0.53 | 0.62 |
| 6 | 0.61 | 0.60 | 0.53 | 0.56 | 0.53 | 1.00 | 0.58 | 0.58 | 0.56 | 0.55 | 0.53 | 0.52 |
| 7 | 0.62 | 0.53 | 0.56 | 0.60 | 0.55 | 0.58 | 1.00 | 0.52 | 0.51 | 0.59 | 0.53 | 0.56 |
| 8 | 0.55 | 0.60 | 0.53 | 0.51 | 0.50 | 0.58 | 0.52 | 1.00 | 0.61 | 0.53 | 0.53 | 0.47 |
| 9 | 0.52 | 0.58 | 0.52 | 0.49 | 0.49 | 0.56 | 0.51 | 0.61 | 1.00 | 0.52 | 0.51 | 0.48 |
| 10 | 0.59 | 0.52 | 0.56 | 0.62 | 0.63 | 0.55 | 0.59 | 0.53 | 0.52 | 1.00 | 0.56 | 0.58 |
| 11 | 0.56 | 0.53 | 0.59 | 0.57 | 0.53 | 0.53 | 0.53 | 0.53 | 0.51 | 0.56 | 1.00 | 0.51 |
| 12 | 0.55 | 0.51 | 0.55 | 0.58 | 0.62 | 0.52 | 0.56 | 0.47 | 0.48 | 0.58 | 0.51 | 1.00 |
The table contains GDT_TS values (calculated on the Cα atoms) between the predicted models.
Read more about the global distance test (GDT, also written as GDT_TS to represent "total score") measure.
© Laboratory of Theory of Biopolymers, Faculty of Chemistry, University of Warsaw 2013