Status: Done started: 2018-May-29 10:46:49 UTC
| Project Name | |
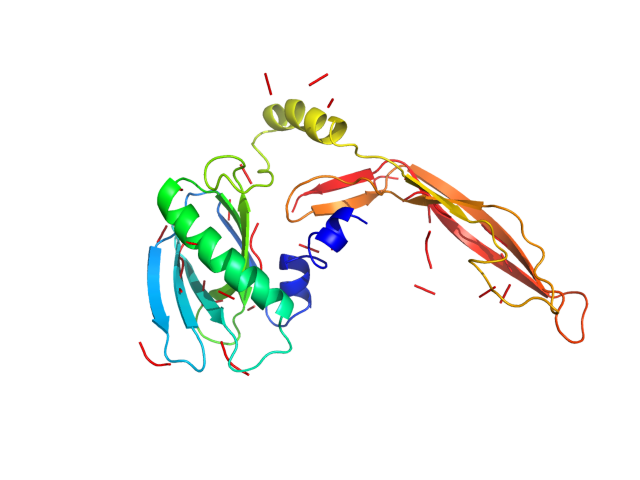
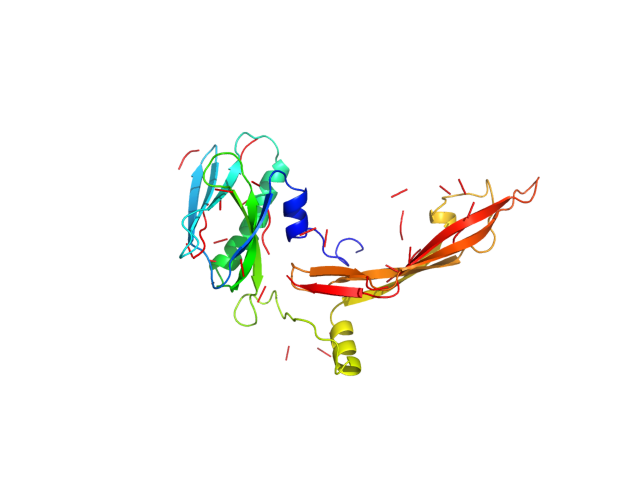
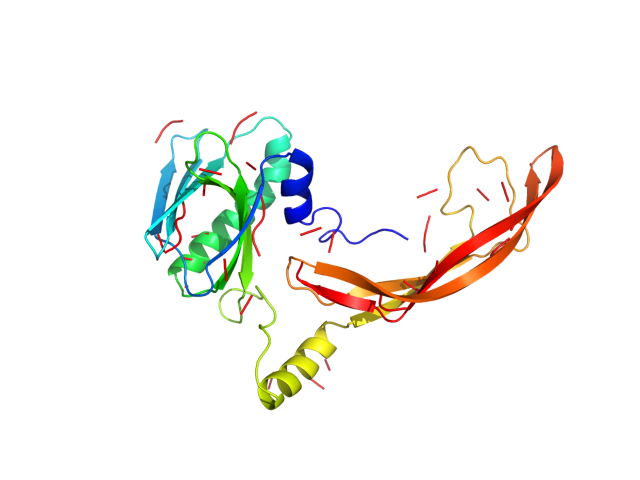
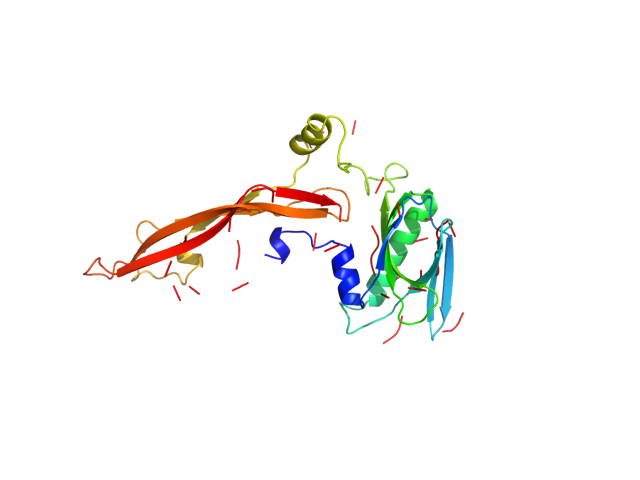
| Sequence | HHHHHHTPQN ITDLCAEYHN TQIHTLNDKI FSYTESLAGK REMAIITFKN GATFQVEVPG SQHIDSQKKV IERMKDTLRI AYLTEAKVEK LCVWNNKTPH AIAAISMANS SGGSGGGSGT FYDIETLKVI DEEWQRTQCH PIETLVDIFQ EYPDEIEYIF KPSCVPLMRC GGCCNDEGLE CVPTEESNIT MQIMRIKPHQ GQHIGEMSFL QHNKCECRPK |
| Secondary structure | CCCCCCCCCC HHHHHHCCCC EEEECCCEEC CEEEEEECCC CEEEEEEECC CEEEECCCCC CCCCCCCHHH HHHHHHHHHH HHHCCCEEEE EEEECCCCCE EEEEEEECCC CCCCCCCCCC CCCCCCCCHH HHHHHCCCCE EEEEEEEHHH HCCCCCCCEE ECCEEEEEEE ECCCCCCCEE EEEEEEEEEE EEEEEECCCC CCCCEEEEEE EEEEEEEEEC |
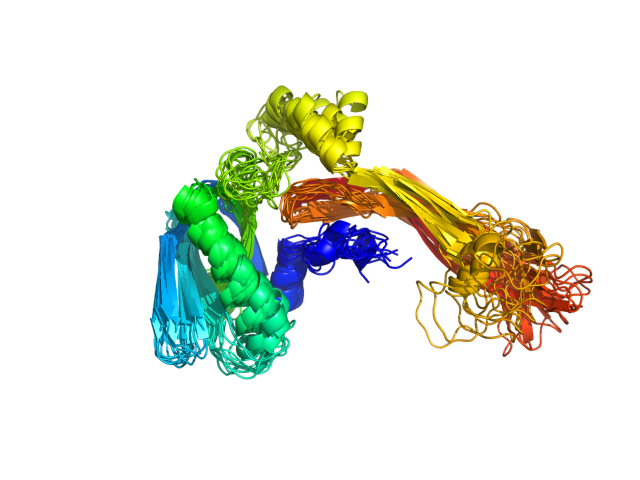
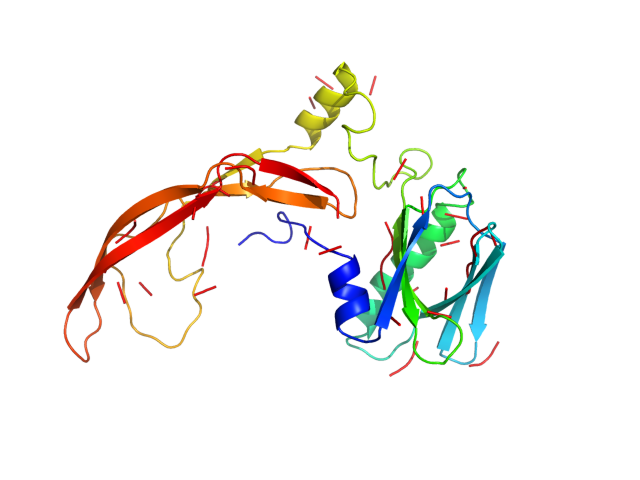
| Movie from predicted structures | To download the movie, right click on the desired file format:  
|
| Estimated finish time | 2018-May-29 15:34 UTC |
| Project Name |


| Project Name |
| Cluster # | 1 | 2 | 3 | 4 | 5 | 6 | 7 | 8 | 9 | 10 | 11 | 12 |
| Cluster density | 149.8 | 149.0 | 134.1 | 128.6 | 117.4 | 115.6 | 92.7 | 89.2 | 84.4 | 65.3 | 53.0 | 41.0 |
| Cluster size | 256 | 243 | 207 | 215 | 192 | 188 | 154 | 153 | 134 | 116 | 75 | 67 |
| Average cluster RMSD | 1.7 | 1.6 | 1.5 | 1.7 | 1.6 | 1.6 | 1.7 | 1.7 | 1.6 | 1.8 | 1.4 | 1.6 |
| # | 1 | 2 | 3 | 4 | 5 | 6 | 7 | 8 | 9 | 10 | 11 | 12 |
| RMSD | 7.25 | 8.71 | 8.94 | 7.45 | 8.60 | 7.95 | 6.92 | 6.67 | 7.11 | 5.81 | 7.82 | 5.62 |
| GDT_TS | 0.46 | 0.45 | 0.47 | 0.48 | 0.45 | 0.47 | 0.47 | 0.50 | 0.47 | 0.51 | 0.47 | 0.51 |
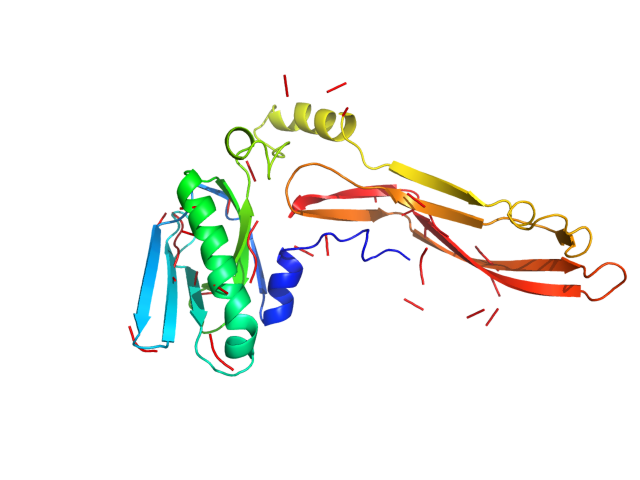
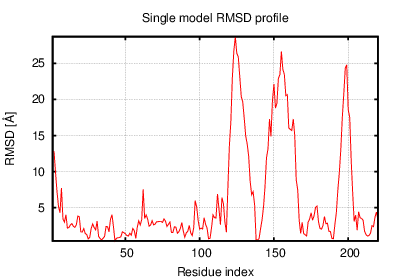
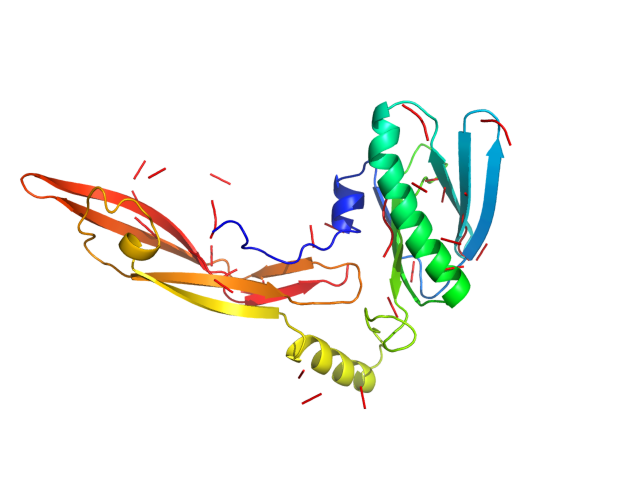
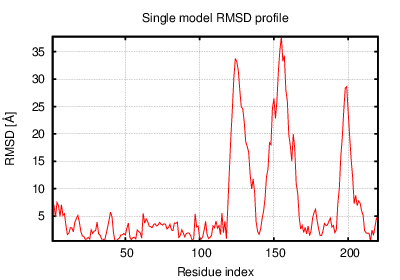
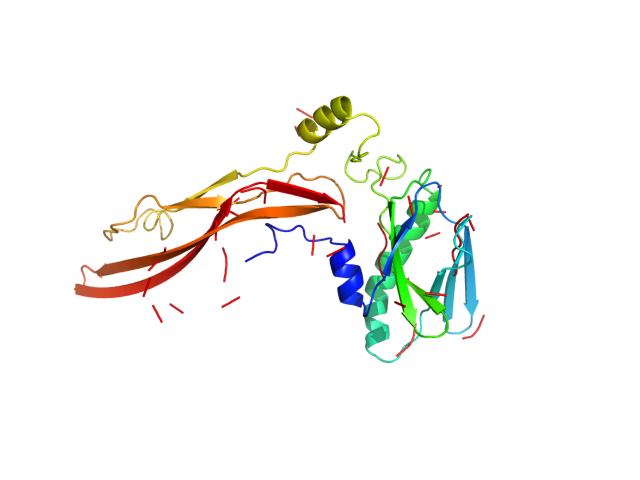
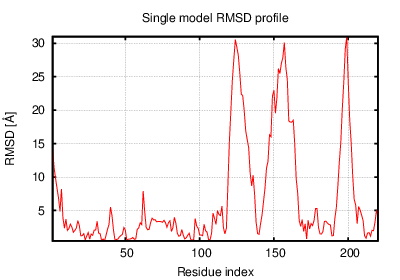
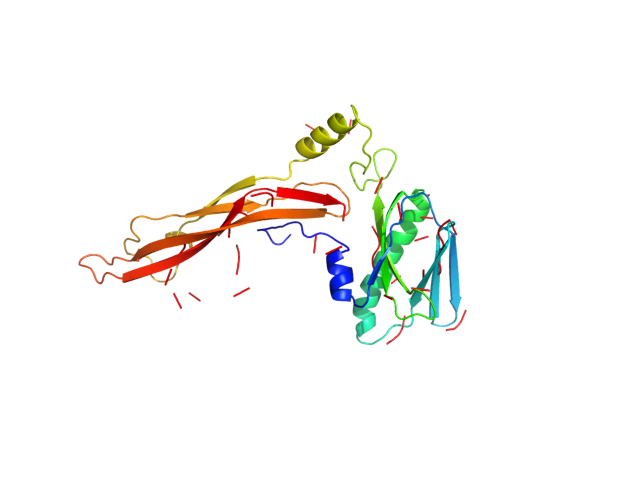
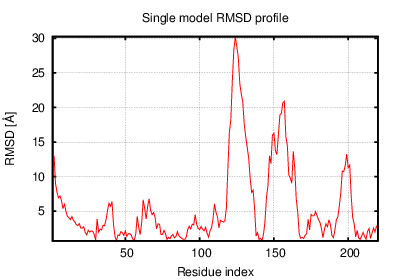
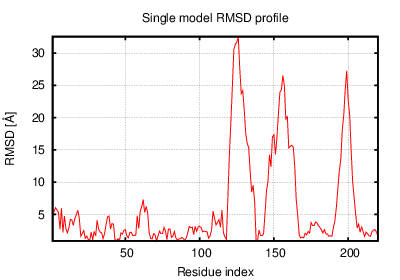
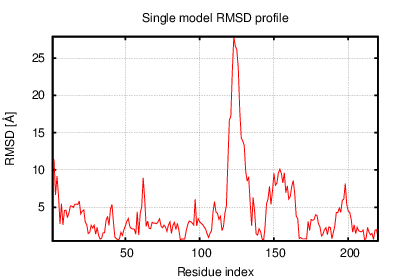
The table contains RMSD and GDT_TS values (calculated on the Cα atoms) between the predicted models and the input structure. Note that GDT_TS metric is intended as a more accurate measurement than the more common RMSD.
Read more about the root-mean-square deviation (RMSD) measure
Read more about the global distance test (GDT, also written as GDT_TS to represent "total score") measure.
| # | 1 | 2 | 3 | 4 | 5 | 6 | 7 | 8 | 9 | 10 | 11 | 12 |
| 1 | 0.00 | 3.92 | 4.01 | 2.64 | 3.84 | 2.56 | 3.21 | 2.59 | 2.72 | 3.43 | 2.54 | 3.92 |
| 2 | 3.92 | 0.00 | 2.50 | 3.08 | 2.57 | 2.91 | 4.53 | 4.74 | 4.75 | 5.18 | 3.92 | 6.11 |
| 3 | 4.01 | 2.50 | 0.00 | 3.13 | 2.50 | 2.93 | 5.14 | 5.06 | 4.99 | 5.71 | 3.98 | 6.54 |
| 4 | 2.64 | 3.08 | 3.13 | 0.00 | 2.85 | 1.97 | 3.76 | 3.66 | 3.72 | 3.87 | 3.26 | 4.65 |
| 5 | 3.84 | 2.57 | 2.50 | 2.85 | 0.00 | 2.90 | 4.66 | 4.80 | 4.64 | 5.11 | 3.81 | 5.89 |
| 6 | 2.56 | 2.91 | 2.93 | 1.97 | 2.90 | 0.00 | 3.97 | 3.68 | 3.61 | 4.32 | 2.96 | 5.13 |
| 7 | 3.21 | 4.53 | 5.14 | 3.76 | 4.66 | 3.97 | 0.00 | 2.99 | 3.78 | 2.69 | 3.52 | 3.33 |
| 8 | 2.59 | 4.74 | 5.06 | 3.66 | 4.80 | 3.68 | 2.99 | 0.00 | 3.15 | 3.17 | 3.04 | 3.41 |
| 9 | 2.72 | 4.75 | 4.99 | 3.72 | 4.64 | 3.61 | 3.78 | 3.15 | 0.00 | 4.07 | 3.21 | 4.25 |
| 10 | 3.43 | 5.18 | 5.71 | 3.87 | 5.11 | 4.32 | 2.69 | 3.17 | 4.07 | 0.00 | 4.01 | 2.40 |
| 11 | 2.54 | 3.92 | 3.98 | 3.26 | 3.81 | 2.96 | 3.52 | 3.04 | 3.21 | 4.01 | 0.00 | 4.59 |
| 12 | 3.92 | 6.11 | 6.54 | 4.65 | 5.89 | 5.13 | 3.33 | 3.41 | 4.25 | 2.40 | 4.59 | 0.00 |
The table contains RMSD values (calculated on the Cα atoms) between the predicted models.
Read more about the root-mean-square deviation (RMSD) measure.
| # | 1 | 2 | 3 | 4 | 5 | 6 | 7 | 8 | 9 | 10 | 11 | 12 |
| 1 | 1.00 | 0.60 | 0.62 | 0.70 | 0.62 | 0.70 | 0.61 | 0.68 | 0.72 | 0.60 | 0.71 | 0.58 |
| 2 | 0.60 | 1.00 | 0.71 | 0.67 | 0.71 | 0.67 | 0.52 | 0.54 | 0.57 | 0.51 | 0.60 | 0.50 |
| 3 | 0.62 | 0.71 | 1.00 | 0.67 | 0.70 | 0.70 | 0.51 | 0.56 | 0.55 | 0.51 | 0.61 | 0.47 |
| 4 | 0.70 | 0.67 | 0.67 | 1.00 | 0.70 | 0.80 | 0.59 | 0.60 | 0.65 | 0.58 | 0.63 | 0.54 |
| 5 | 0.62 | 0.71 | 0.70 | 0.70 | 1.00 | 0.74 | 0.52 | 0.56 | 0.59 | 0.52 | 0.60 | 0.48 |
| 6 | 0.70 | 0.67 | 0.70 | 0.80 | 0.74 | 1.00 | 0.57 | 0.60 | 0.64 | 0.56 | 0.65 | 0.52 |
| 7 | 0.61 | 0.52 | 0.51 | 0.59 | 0.52 | 0.57 | 1.00 | 0.65 | 0.59 | 0.73 | 0.62 | 0.66 |
| 8 | 0.68 | 0.54 | 0.56 | 0.60 | 0.56 | 0.60 | 0.65 | 1.00 | 0.66 | 0.65 | 0.66 | 0.63 |
| 9 | 0.72 | 0.57 | 0.55 | 0.65 | 0.59 | 0.64 | 0.59 | 0.66 | 1.00 | 0.57 | 0.65 | 0.55 |
| 10 | 0.60 | 0.51 | 0.51 | 0.58 | 0.52 | 0.56 | 0.73 | 0.65 | 0.57 | 1.00 | 0.60 | 0.73 |
| 11 | 0.71 | 0.60 | 0.61 | 0.63 | 0.60 | 0.65 | 0.62 | 0.66 | 0.65 | 0.60 | 1.00 | 0.60 |
| 12 | 0.58 | 0.50 | 0.47 | 0.54 | 0.48 | 0.52 | 0.66 | 0.63 | 0.55 | 0.73 | 0.60 | 1.00 |
The table contains GDT_TS values (calculated on the Cα atoms) between the predicted models.
Read more about the global distance test (GDT, also written as GDT_TS to represent "total score") measure.
© Laboratory of Theory of Biopolymers, Faculty of Chemistry, University of Warsaw 2013