Status: Done started: 2018-Aug-06 05:16:52 UTC
| Project Name | |
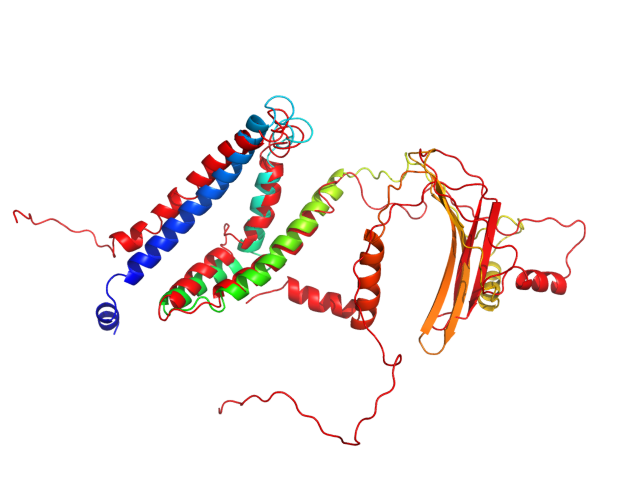
| Sequence | RGDEAAAKYP HLENDSYAAY GVKNNLIGKA AYIASVLTVL FAAYSLSIDV TSLKKSIIYG IAPPPQFKKK NKLRMMLSSK GIDKKGMAYF PYIASVLTKK YKKKYFALRM RMKQNWYAFT SSMKQGNTGG GGSNPFKGLS TDRKMDEVSG GGGSLSSKGI DQKMRVLGGG GSKFGSAIRN RNGGGGSTTR EIEQVELLKG GGGSIPTMKI ALKGGGGSKC KNCKYKKKYF ALGGGGSASN DPLTSFSIRS NAVKTNA |
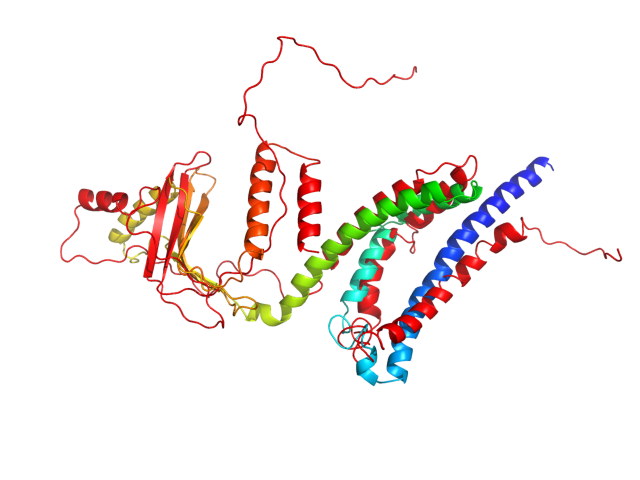
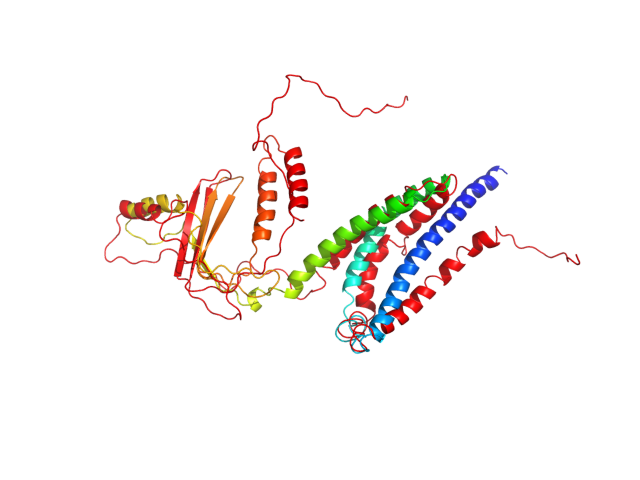
| Secondary structure | CCCCCCCCCC CCCHHHHHHH HHHHHHHHHH HHHHHHHHHH HHHHHCCCCC CCCCCCCCCC CCCCHHHHHH HHHHHHHCCC CCCCHHHHHH HHHHHHHCCC CCCHHHHHHH HHHHHHHHHH HHHCCCCCCC CCCCCCCCCC CCCCCCCCCC CCCCCCHHHH HHHHHHCCCC CCCCCCCCCC CCCCCCCCCC CEEEEEEEEE CCCCCCEEEE EEEECCCCCC CCCCCCCCCC CCCCCCCCCC CCCCCCCCCC CCCCCCC |
| Movie from predicted structures | To download the movie, right click on the desired file format:  
|
| Estimated finish time | 2018-Aug-06 10:09 UTC |
| Project Name |
| Project Name |
| Cluster # | 1 | 2 | 3 | 4 | 5 | 6 | 7 | 8 | 9 | 10 | 11 | 12 |
| Cluster density | 96.0 | 86.2 | 78.7 | 73.2 | 72.5 | 71.4 | 68.3 | 65.9 | 61.0 | 59.3 | 43.6 | 28.0 |
| Cluster size | 249 | 215 | 203 | 159 | 189 | 158 | 203 | 158 | 137 | 162 | 101 | 66 |
| Average cluster RMSD | 2.6 | 2.5 | 2.6 | 2.2 | 2.6 | 2.2 | 3.0 | 2.4 | 2.2 | 2.7 | 2.3 | 2.4 |
| # | 1 | 2 | 3 | 4 | 5 | 6 | 7 | 8 | 9 | 10 | 11 | 12 |
| RMSD | 11.60 | 17.20 | 16.10 | 14.90 | 15.70 | 12.70 | 12.10 | 17.90 | 17.50 | 11.70 | 13.40 | 11.40 |
| GDT_TS | 0.30 | 0.23 | 0.26 | 0.30 | 0.28 | 0.29 | 0.30 | 0.26 | 0.24 | 0.29 | 0.31 | 0.36 |
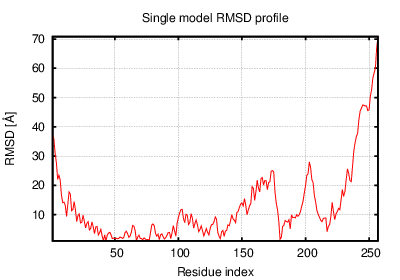
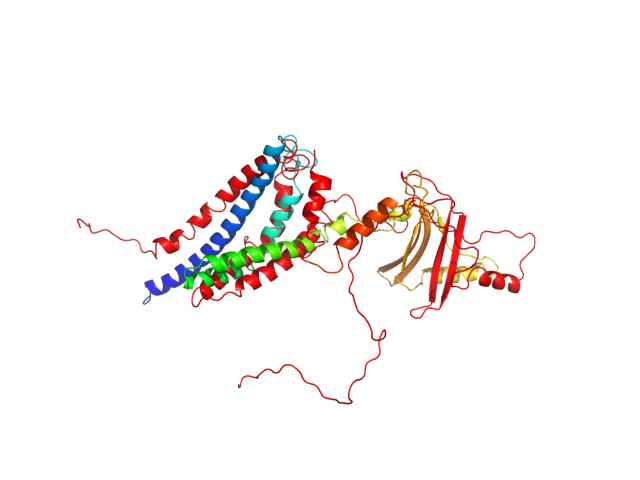
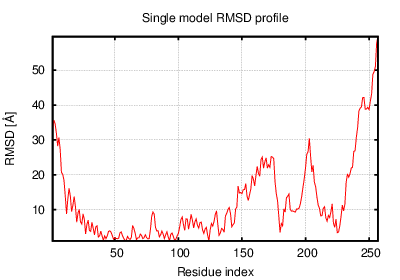
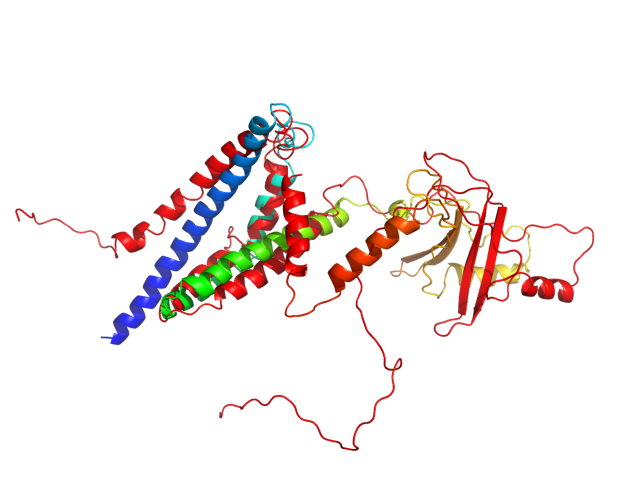
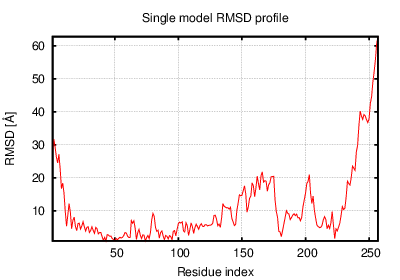
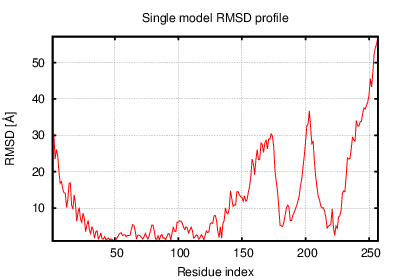
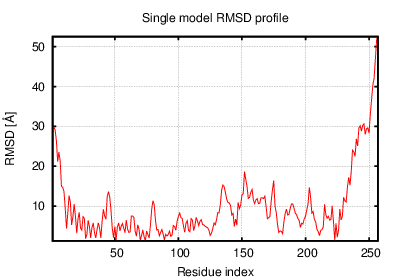
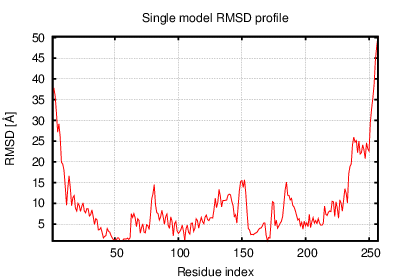
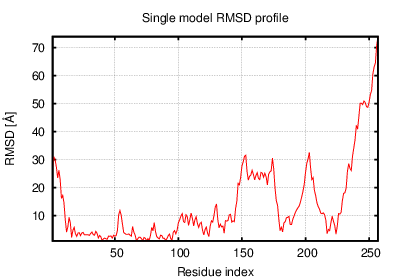
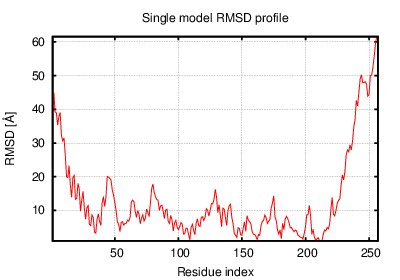
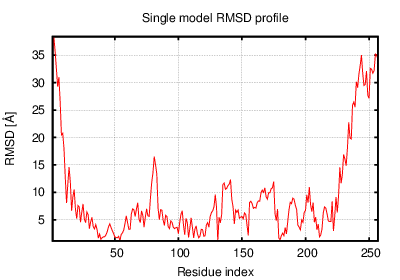
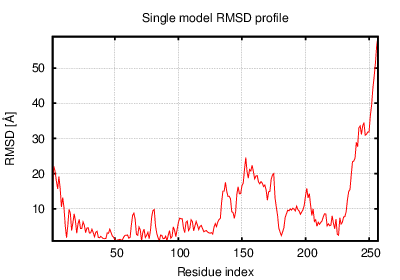
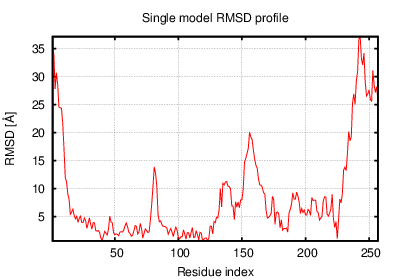
The table contains RMSD and GDT_TS values (calculated on the Cα atoms) between the predicted models and the input structure. Note that GDT_TS metric is intended as a more accurate measurement than the more common RMSD.
Read more about the root-mean-square deviation (RMSD) measure
Read more about the global distance test (GDT, also written as GDT_TS to represent "total score") measure.
| # | 1 | 2 | 3 | 4 | 5 | 6 | 7 | 8 | 9 | 10 | 11 | 12 |
| 1 | 0.00 | 12.40 | 11.60 | 9.93 | 11.90 | 6.96 | 7.42 | 13.40 | 11.10 | 4.82 | 9.03 | 4.85 |
| 2 | 12.40 | 0.00 | 4.51 | 5.57 | 4.69 | 9.22 | 11.20 | 5.20 | 8.69 | 11.60 | 7.90 | 12.40 |
| 3 | 11.60 | 4.51 | 0.00 | 4.61 | 4.60 | 8.23 | 10.10 | 4.87 | 7.42 | 10.60 | 7.01 | 11.30 |
| 4 | 9.93 | 5.57 | 4.61 | 0.00 | 5.02 | 5.99 | 7.77 | 5.54 | 7.17 | 9.44 | 4.12 | 9.73 |
| 5 | 11.90 | 4.69 | 4.60 | 5.02 | 0.00 | 8.44 | 10.20 | 5.88 | 8.43 | 11.10 | 7.04 | 12.00 |
| 6 | 6.96 | 9.22 | 8.23 | 5.99 | 8.44 | 0.00 | 4.52 | 9.97 | 9.65 | 7.30 | 4.32 | 7.35 |
| 7 | 7.42 | 11.20 | 10.10 | 7.77 | 10.20 | 4.52 | 0.00 | 11.60 | 11.60 | 8.06 | 5.95 | 7.91 |
| 8 | 13.40 | 5.20 | 4.87 | 5.54 | 5.88 | 9.97 | 11.60 | 0.00 | 8.07 | 13.10 | 8.05 | 13.20 |
| 9 | 11.10 | 8.69 | 7.42 | 7.17 | 8.43 | 9.65 | 11.60 | 8.07 | 0.00 | 10.40 | 9.29 | 11.00 |
| 10 | 4.82 | 11.60 | 10.60 | 9.44 | 11.10 | 7.30 | 8.06 | 13.10 | 10.40 | 0.00 | 9.17 | 5.32 |
| 11 | 9.03 | 7.90 | 7.01 | 4.12 | 7.04 | 4.32 | 5.95 | 8.05 | 9.29 | 9.17 | 0.00 | 8.76 |
| 12 | 4.85 | 12.40 | 11.30 | 9.73 | 12.00 | 7.35 | 7.91 | 13.20 | 11.00 | 5.32 | 8.76 | 0.00 |
The table contains RMSD values (calculated on the Cα atoms) between the predicted models.
Read more about the root-mean-square deviation (RMSD) measure.
| # | 1 | 2 | 3 | 4 | 5 | 6 | 7 | 8 | 9 | 10 | 11 | 12 |
| 1 | 1.00 | 0.31 | 0.35 | 0.41 | 0.34 | 0.43 | 0.43 | 0.35 | 0.35 | 0.48 | 0.42 | 0.47 |
| 2 | 0.31 | 1.00 | 0.57 | 0.47 | 0.55 | 0.34 | 0.37 | 0.51 | 0.45 | 0.36 | 0.39 | 0.29 |
| 3 | 0.35 | 0.57 | 1.00 | 0.48 | 0.53 | 0.35 | 0.37 | 0.55 | 0.40 | 0.39 | 0.40 | 0.33 |
| 4 | 0.41 | 0.47 | 0.48 | 1.00 | 0.46 | 0.48 | 0.49 | 0.53 | 0.43 | 0.44 | 0.60 | 0.39 |
| 5 | 0.34 | 0.55 | 0.53 | 0.46 | 1.00 | 0.35 | 0.37 | 0.47 | 0.40 | 0.35 | 0.41 | 0.32 |
| 6 | 0.43 | 0.34 | 0.35 | 0.48 | 0.35 | 1.00 | 0.52 | 0.35 | 0.39 | 0.43 | 0.55 | 0.39 |
| 7 | 0.43 | 0.37 | 0.37 | 0.49 | 0.37 | 0.52 | 1.00 | 0.40 | 0.36 | 0.45 | 0.47 | 0.40 |
| 8 | 0.35 | 0.51 | 0.55 | 0.53 | 0.47 | 0.35 | 0.40 | 1.00 | 0.39 | 0.41 | 0.41 | 0.31 |
| 9 | 0.35 | 0.45 | 0.40 | 0.43 | 0.40 | 0.39 | 0.36 | 0.39 | 1.00 | 0.40 | 0.38 | 0.29 |
| 10 | 0.48 | 0.36 | 0.39 | 0.44 | 0.35 | 0.43 | 0.45 | 0.41 | 0.40 | 1.00 | 0.40 | 0.43 |
| 11 | 0.42 | 0.39 | 0.40 | 0.60 | 0.41 | 0.55 | 0.47 | 0.41 | 0.38 | 0.40 | 1.00 | 0.40 |
| 12 | 0.47 | 0.29 | 0.33 | 0.39 | 0.32 | 0.39 | 0.40 | 0.31 | 0.29 | 0.43 | 0.40 | 1.00 |
The table contains GDT_TS values (calculated on the Cα atoms) between the predicted models.
Read more about the global distance test (GDT, also written as GDT_TS to represent "total score") measure.
© Laboratory of Theory of Biopolymers, Faculty of Chemistry, University of Warsaw 2013