Status: Done started: 2018-May-10 10:22:31 UTC
| Project Name | anil_disorder |
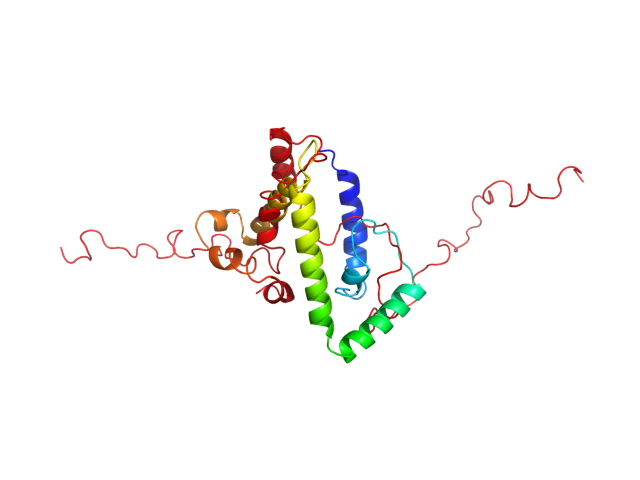
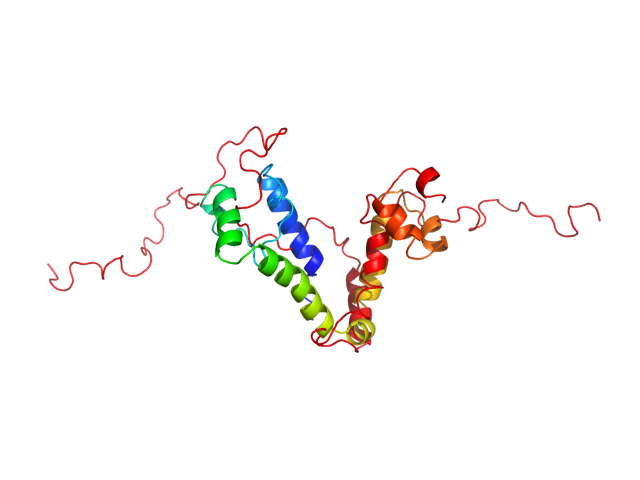
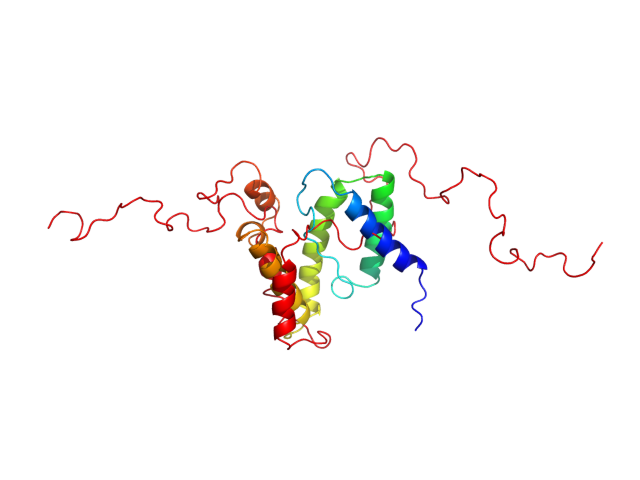
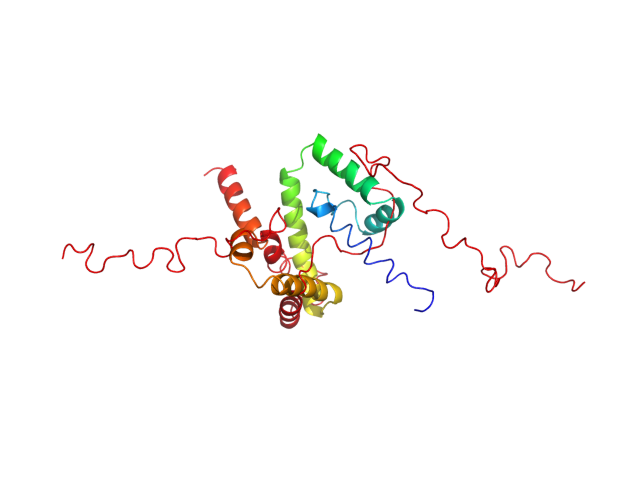
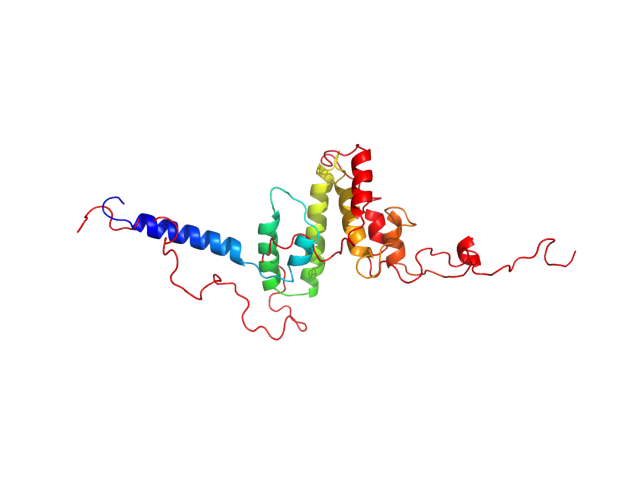
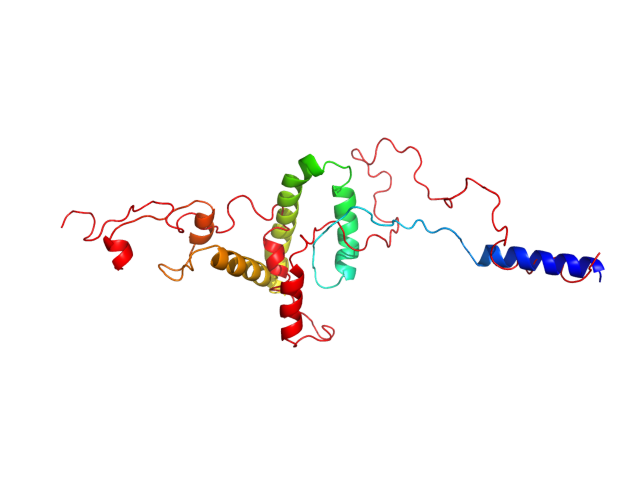
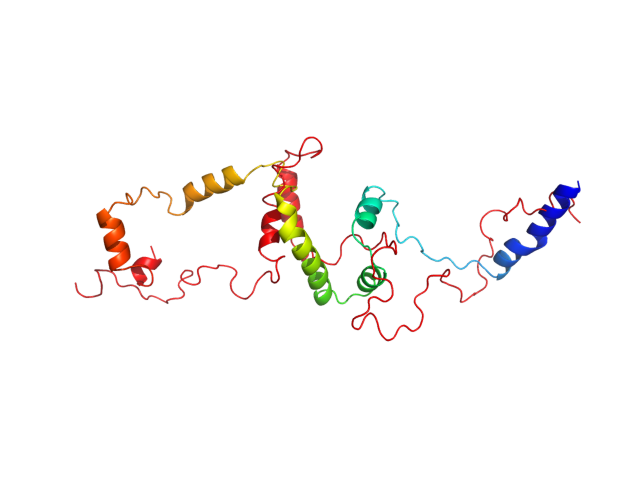
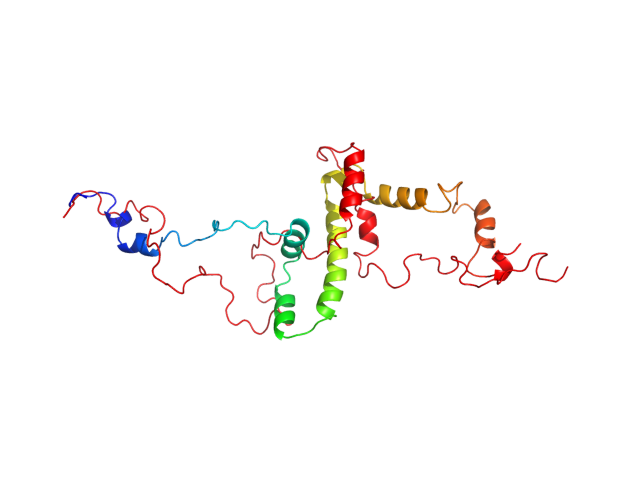
| Sequence | GPLGSPSKDC GSPKYAYFNG CSSPTAPLSP MSPPGYKLVT GDRNNSSCRN YNKQASEQNW ANYSAEQNRM GQAGSTISNS HAQPFDFPDD NQNAKKVAAG HELQPLAIVD QRPSSRASSR ASSRPRPDDL EI |
| Secondary structure | CCCCCCCCCC CCCCCCCCCC CCCCCCCCCC CCCCCCCCCC CCCCCCCCCC CCCCCCCCCC CCCCCCHHHH HHHHHCCCCC CCCCCCCCCC CHHHHHHHCC CCCCCCCCCC CCCCCCCCCC CCCCCCCCCC CC |
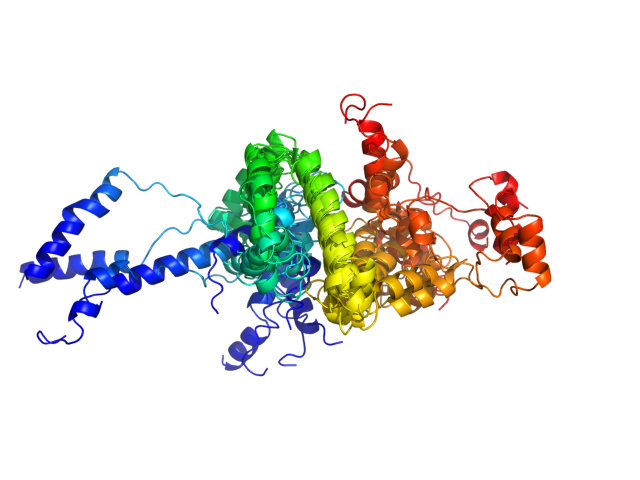
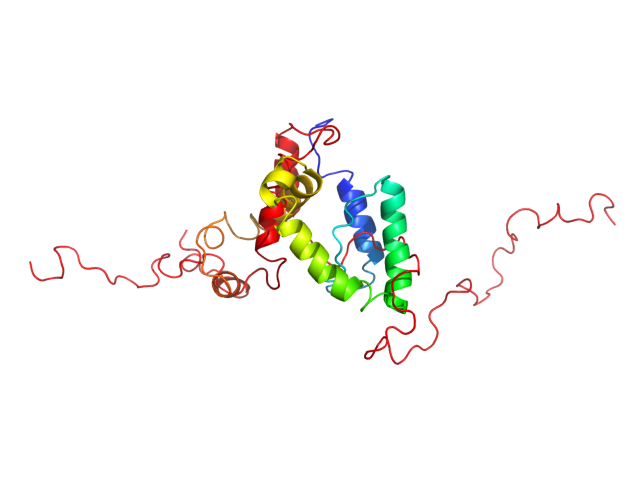
| Movie from predicted structures | To download the movie, right click on the desired file format:  
|
| Estimated finish time | 2018-May-10 14:58 UTC |
| Project Name | anil_disorder |


| Project Name | anil_disorder |
| Cluster # | 1 | 2 | 3 | 4 | 5 | 6 | 7 | 8 | 9 | 10 |
| Cluster density | 106.3 | 73.9 | 64.1 | 57.4 | 44.6 | 36.9 | 35.1 | 23.3 | 17.0 | 11.2 |
| Cluster size | 460 | 338 | 230 | 206 | 169 | 220 | 147 | 113 | 78 | 39 |
| Average cluster RMSD | 4.3 | 4.6 | 3.6 | 3.6 | 3.8 | 6.0 | 4.2 | 4.8 | 4.6 | 3.5 |
| # | 1 | 2 | 3 | 4 | 5 | 6 | 7 | 8 | 9 | 10 |
| RMSD | 24.60 | 24.70 | 24.10 | 22.30 | 23.10 | 19.60 | 16.90 | 16.20 | 17.20 | 16.30 |
| GDT_TS | 0.14 | 0.16 | 0.15 | 0.17 | 0.17 | 0.18 | 0.15 | 0.16 | 0.16 | 0.16 |
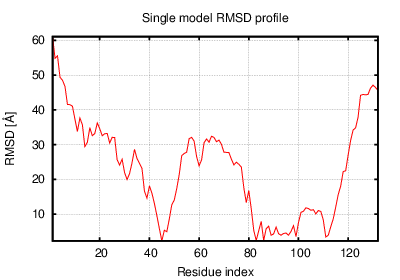
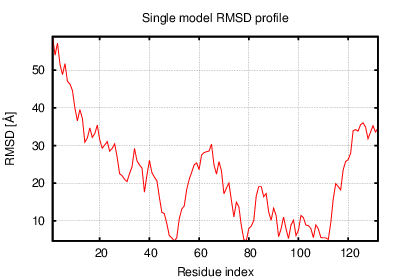
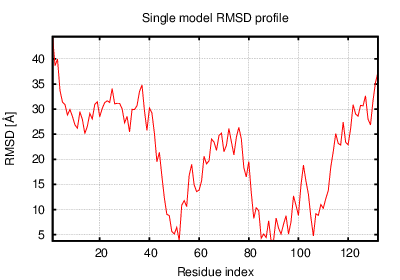
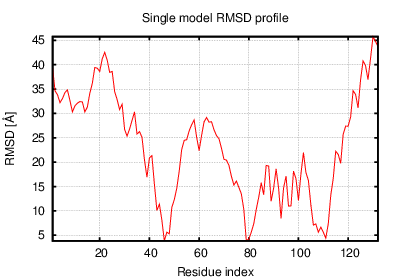
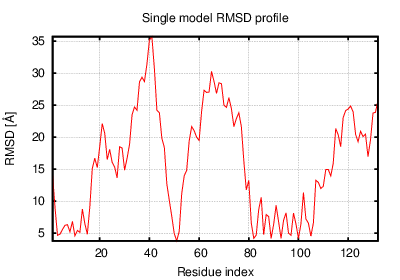
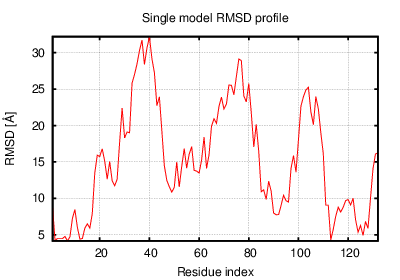
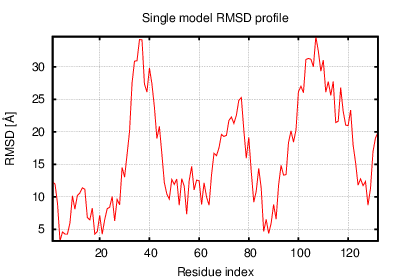
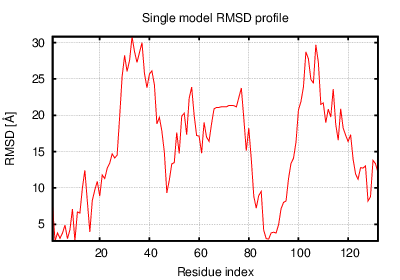
The table contains RMSD and GDT_TS values (calculated on the Cα atoms) between the predicted models and the input structure. Note that GDT_TS metric is intended as a more accurate measurement than the more common RMSD.
Read more about the root-mean-square deviation (RMSD) measure
Read more about the global distance test (GDT, also written as GDT_TS to represent "total score") measure.
| # | 1 | 2 | 3 | 4 | 5 | 6 | 7 | 8 | 9 | 10 |
| 1 | 0.00 | 9.49 | 7.68 | 9.30 | 11.50 | 12.90 | 14.40 | 20.70 | 24.40 | 22.50 |
| 2 | 9.49 | 0.00 | 7.73 | 11.50 | 8.54 | 10.60 | 16.70 | 22.30 | 24.60 | 22.70 |
| 3 | 7.68 | 7.73 | 0.00 | 10.80 | 10.80 | 13.30 | 15.80 | 22.20 | 24.40 | 22.70 |
| 4 | 9.30 | 11.50 | 10.80 | 0.00 | 10.40 | 11.00 | 11.50 | 18.10 | 22.10 | 20.40 |
| 5 | 11.50 | 8.54 | 10.80 | 10.40 | 0.00 | 6.57 | 15.10 | 20.70 | 23.70 | 21.60 |
| 6 | 12.90 | 10.60 | 13.30 | 11.00 | 6.57 | 0.00 | 12.90 | 17.90 | 21.70 | 19.30 |
| 7 | 14.40 | 16.70 | 15.80 | 11.50 | 15.10 | 12.90 | 0.00 | 8.73 | 15.20 | 12.50 |
| 8 | 20.70 | 22.30 | 22.20 | 18.10 | 20.70 | 17.90 | 8.73 | 0.00 | 11.20 | 9.43 |
| 9 | 24.40 | 24.60 | 24.40 | 22.10 | 23.70 | 21.70 | 15.20 | 11.20 | 0.00 | 8.06 |
| 10 | 22.50 | 22.70 | 22.70 | 20.40 | 21.60 | 19.30 | 12.50 | 9.43 | 8.06 | 0.00 |
The table contains RMSD values (calculated on the Cα atoms) between the predicted models.
Read more about the root-mean-square deviation (RMSD) measure.
| # | 1 | 2 | 3 | 4 | 5 | 6 | 7 | 8 | 9 | 10 |
| 1 | 1.00 | 0.29 | 0.33 | 0.29 | 0.31 | 0.25 | 0.28 | 0.30 | 0.20 | 0.23 |
| 2 | 0.29 | 1.00 | 0.34 | 0.28 | 0.32 | 0.31 | 0.30 | 0.31 | 0.20 | 0.26 |
| 3 | 0.33 | 0.34 | 1.00 | 0.28 | 0.27 | 0.26 | 0.27 | 0.29 | 0.20 | 0.22 |
| 4 | 0.29 | 0.28 | 0.28 | 1.00 | 0.29 | 0.30 | 0.31 | 0.30 | 0.22 | 0.27 |
| 5 | 0.31 | 0.32 | 0.27 | 0.29 | 1.00 | 0.41 | 0.24 | 0.24 | 0.19 | 0.23 |
| 6 | 0.25 | 0.31 | 0.26 | 0.30 | 0.41 | 1.00 | 0.26 | 0.23 | 0.20 | 0.23 |
| 7 | 0.28 | 0.30 | 0.27 | 0.31 | 0.24 | 0.26 | 1.00 | 0.37 | 0.24 | 0.26 |
| 8 | 0.30 | 0.31 | 0.29 | 0.30 | 0.24 | 0.23 | 0.37 | 1.00 | 0.24 | 0.27 |
| 9 | 0.20 | 0.20 | 0.20 | 0.22 | 0.19 | 0.20 | 0.24 | 0.24 | 1.00 | 0.32 |
| 10 | 0.23 | 0.26 | 0.22 | 0.27 | 0.23 | 0.23 | 0.26 | 0.27 | 0.32 | 1.00 |
The table contains GDT_TS values (calculated on the Cα atoms) between the predicted models.
Read more about the global distance test (GDT, also written as GDT_TS to represent "total score") measure.
© Laboratory of Theory of Biopolymers, Faculty of Chemistry, University of Warsaw 2013