Status: Done started: 2018-Jun-25 07:18:16 UTC
| Project Name | |
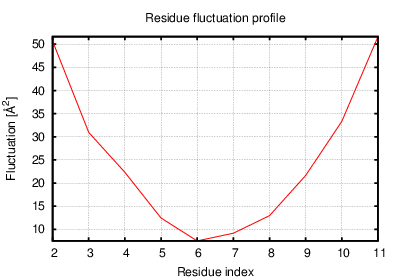
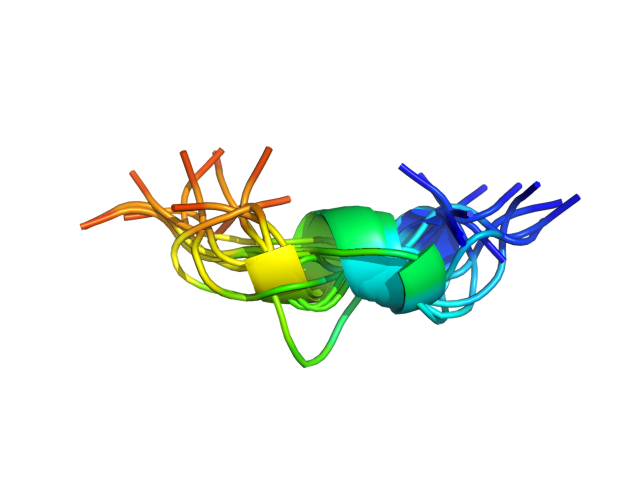
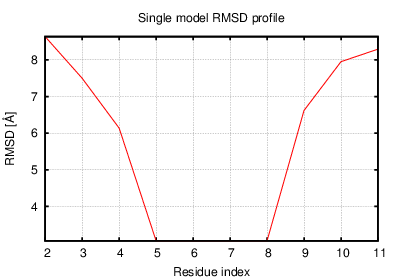
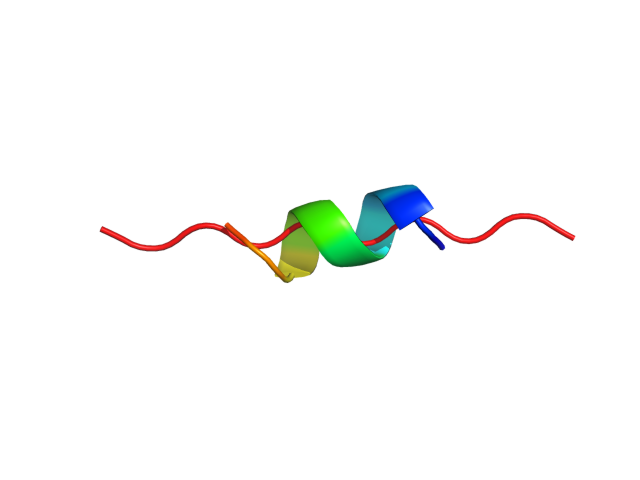
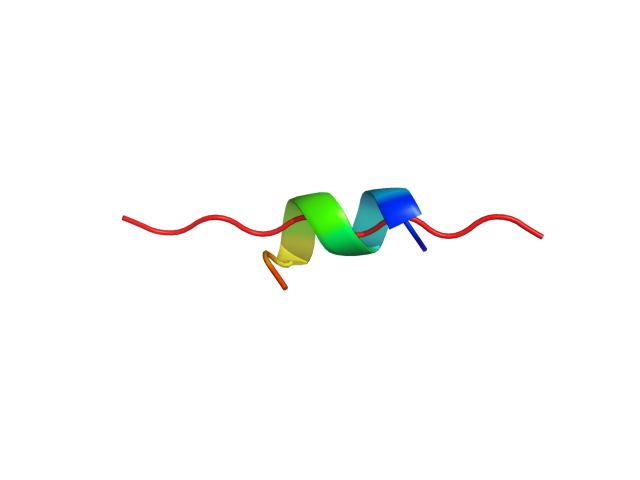
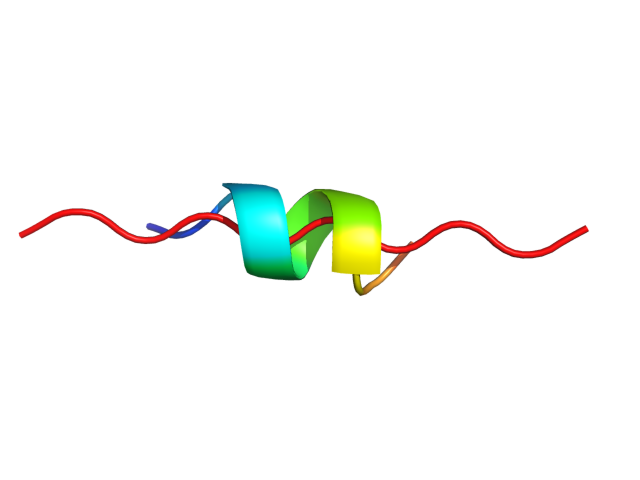
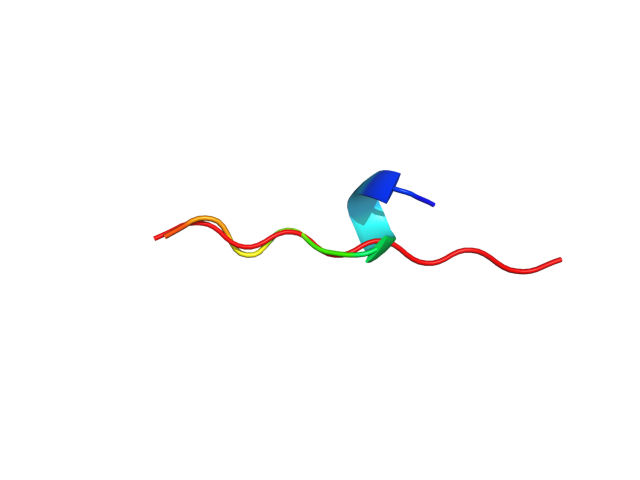
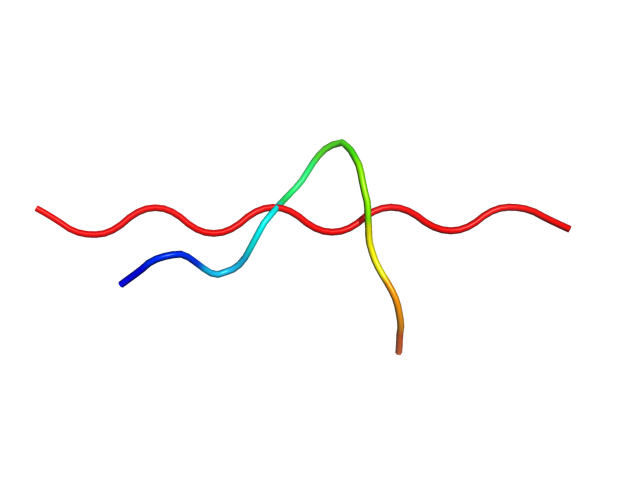
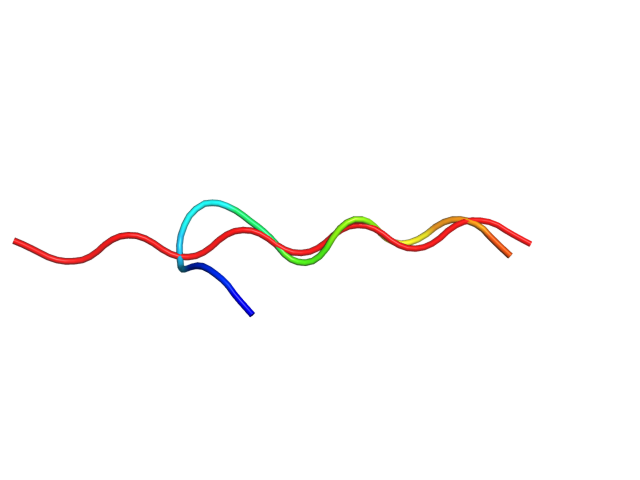
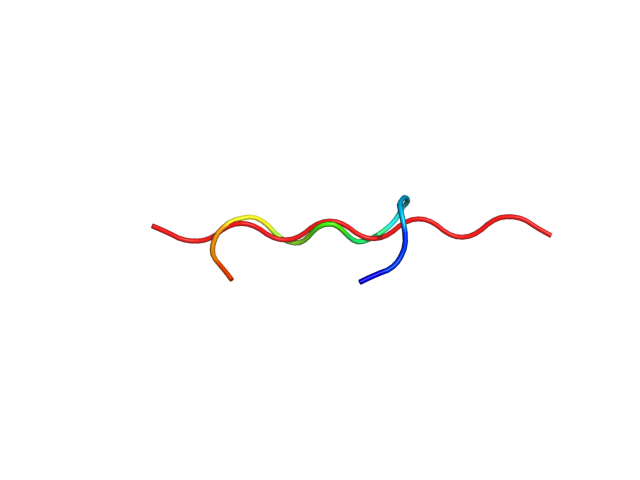
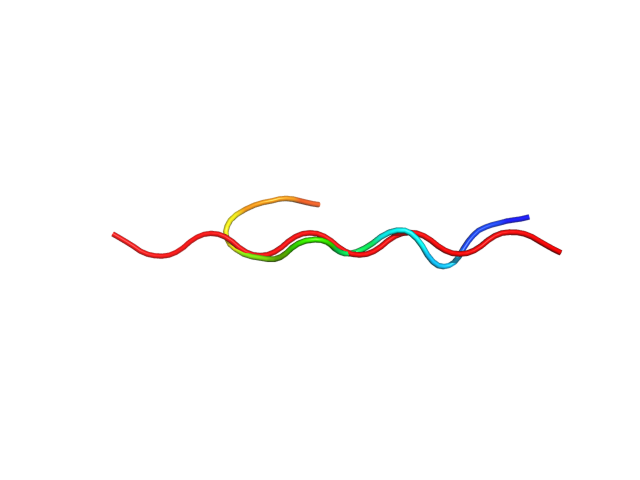
| Sequence | TDAHRGEYYW |
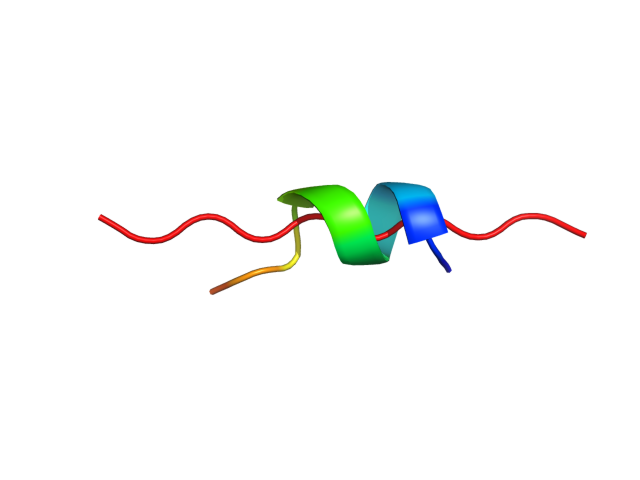
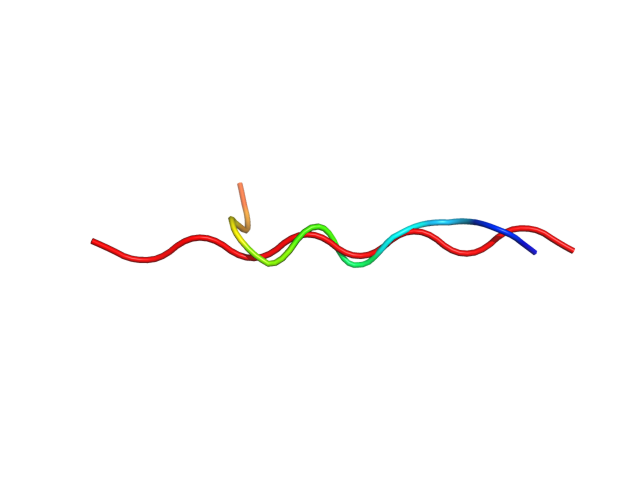
| Secondary structure | CCCCCCCCCC |
| Movie from predicted structures | To download the movie, right click on the desired file format:  
|
| Estimated finish time | 2018-Jun-25 11:38 UTC |
| Project Name |
| Project Name |
| Cluster # | 1 | 2 | 3 | 4 | 5 | 6 | 7 | 8 | 9 | 10 | 11 | 12 |
| Cluster density | 709.2 | 146.8 | 102.8 | 88.6 | 50.5 | 46.5 | 45.2 | 42.0 | 37.2 | 36.6 | 36.1 | 31.9 |
| Cluster size | 727 | 266 | 185 | 178 | 101 | 98 | 98 | 67 | 69 | 71 | 76 | 64 |
| Average cluster RMSD | 1.0 | 1.8 | 1.8 | 2.0 | 2.0 | 2.1 | 2.2 | 1.6 | 1.9 | 1.9 | 2.1 | 2.0 |
| # | 1 | 2 | 3 | 4 | 5 | 6 | 7 | 8 | 9 | 10 | 11 | 12 |
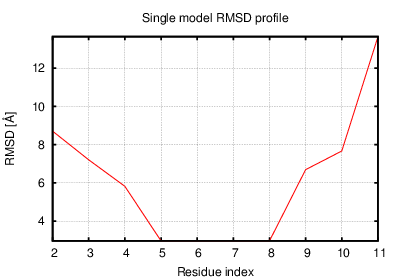
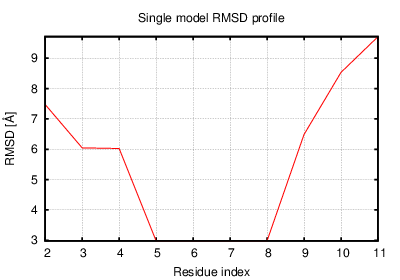
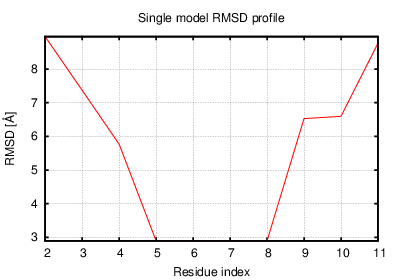
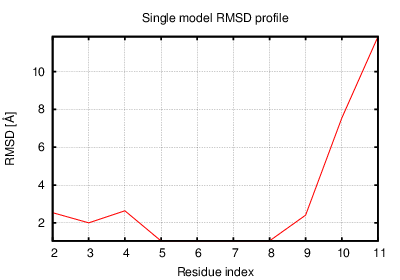
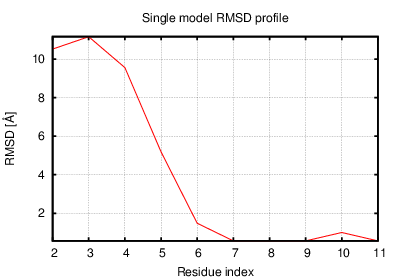
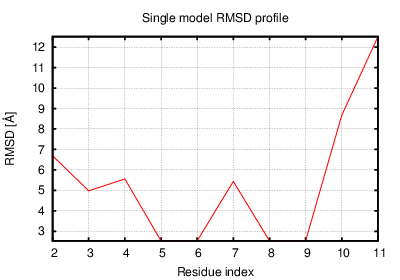
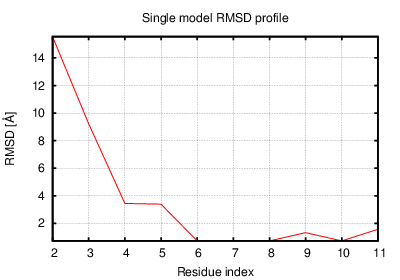
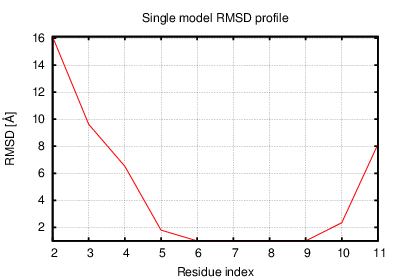
| RMSD | 6.09 | 6.57 | 5.92 | 5.77 | 3.89 | 4.43 | 5.92 | 2.19 | 3.01 | 5.11 | 6.21 | 5.26 |
| GDT_TS | 0.45 | 0.42 | 0.53 | 0.50 | 0.70 | 0.70 | 0.60 | 0.75 | 0.75 | 0.70 | 0.60 | 0.72 |
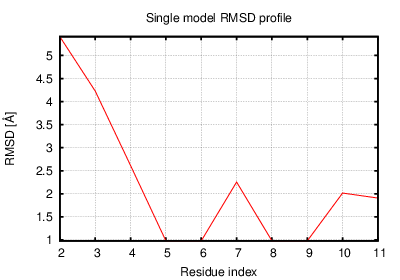
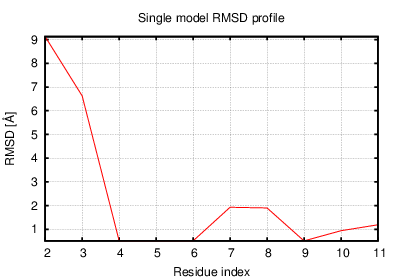
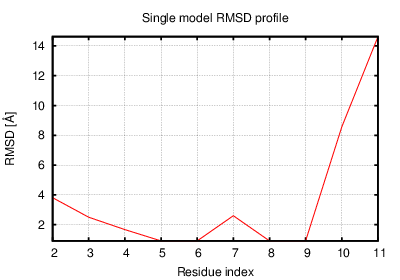
The table contains RMSD and GDT_TS values (calculated on the Cα atoms) between the predicted models and the input structure. Note that GDT_TS metric is intended as a more accurate measurement than the more common RMSD.
Read more about the root-mean-square deviation (RMSD) measure
Read more about the global distance test (GDT, also written as GDT_TS to represent "total score") measure.
| # | 1 | 2 | 3 | 4 | 5 | 6 | 7 | 8 | 9 | 10 | 11 | 12 |
| 1 | 0.00 | 1.91 | 1.71 | 1.89 | 4.09 | 3.04 | 4.16 | 4.93 | 4.54 | 3.95 | 3.59 | 4.24 |
| 2 | 1.91 | 0.00 | 2.37 | 1.98 | 4.12 | 3.88 | 3.57 | 5.33 | 4.89 | 3.95 | 3.13 | 3.89 |
| 3 | 1.71 | 2.37 | 0.00 | 2.59 | 3.66 | 3.24 | 3.70 | 4.81 | 4.58 | 3.76 | 3.41 | 3.73 |
| 4 | 1.89 | 1.98 | 2.59 | 0.00 | 3.85 | 3.29 | 3.36 | 4.36 | 4.01 | 3.45 | 3.49 | 4.22 |
| 5 | 4.09 | 4.12 | 3.66 | 3.85 | 0.00 | 3.37 | 3.00 | 2.90 | 3.56 | 4.12 | 4.27 | 2.70 |
| 6 | 3.04 | 3.88 | 3.24 | 3.29 | 3.37 | 0.00 | 3.67 | 3.24 | 3.14 | 3.21 | 3.43 | 4.34 |
| 7 | 4.16 | 3.57 | 3.70 | 3.36 | 3.00 | 3.67 | 0.00 | 4.27 | 4.26 | 4.26 | 3.99 | 3.32 |
| 8 | 4.93 | 5.33 | 4.81 | 4.36 | 2.90 | 3.24 | 4.27 | 0.00 | 1.61 | 3.88 | 4.76 | 4.22 |
| 9 | 4.54 | 4.89 | 4.58 | 4.01 | 3.56 | 3.14 | 4.26 | 1.61 | 0.00 | 3.11 | 4.11 | 4.31 |
| 10 | 3.95 | 3.95 | 3.76 | 3.45 | 4.12 | 3.21 | 4.26 | 3.88 | 3.11 | 0.00 | 2.08 | 4.70 |
| 11 | 3.59 | 3.13 | 3.41 | 3.49 | 4.27 | 3.43 | 3.99 | 4.76 | 4.11 | 2.08 | 0.00 | 4.19 |
| 12 | 4.24 | 3.89 | 3.73 | 4.22 | 2.70 | 4.34 | 3.32 | 4.22 | 4.31 | 4.70 | 4.19 | 0.00 |
The table contains RMSD values (calculated on the Cα atoms) between the predicted models.
Read more about the root-mean-square deviation (RMSD) measure.
| # | 1 | 2 | 3 | 4 | 5 | 6 | 7 | 8 | 9 | 10 | 11 | 12 |
| 1 | 1.00 | 0.93 | 0.95 | 0.85 | 0.57 | 0.75 | 0.57 | 0.45 | 0.57 | 0.65 | 0.70 | 0.62 |
| 2 | 0.93 | 1.00 | 0.88 | 0.88 | 0.62 | 0.72 | 0.60 | 0.42 | 0.55 | 0.62 | 0.70 | 0.62 |
| 3 | 0.95 | 0.88 | 1.00 | 0.82 | 0.60 | 0.70 | 0.60 | 0.55 | 0.53 | 0.62 | 0.65 | 0.57 |
| 4 | 0.85 | 0.88 | 0.82 | 1.00 | 0.62 | 0.72 | 0.70 | 0.57 | 0.57 | 0.60 | 0.62 | 0.57 |
| 5 | 0.57 | 0.62 | 0.60 | 0.62 | 1.00 | 0.60 | 0.70 | 0.70 | 0.70 | 0.60 | 0.62 | 0.70 |
| 6 | 0.75 | 0.72 | 0.70 | 0.72 | 0.60 | 1.00 | 0.62 | 0.68 | 0.65 | 0.65 | 0.72 | 0.50 |
| 7 | 0.57 | 0.60 | 0.60 | 0.70 | 0.70 | 0.62 | 1.00 | 0.68 | 0.62 | 0.53 | 0.47 | 0.65 |
| 8 | 0.45 | 0.42 | 0.55 | 0.57 | 0.70 | 0.68 | 0.68 | 1.00 | 0.85 | 0.72 | 0.62 | 0.70 |
| 9 | 0.57 | 0.55 | 0.53 | 0.57 | 0.70 | 0.65 | 0.62 | 0.85 | 1.00 | 0.72 | 0.60 | 0.68 |
| 10 | 0.65 | 0.62 | 0.62 | 0.60 | 0.60 | 0.65 | 0.53 | 0.72 | 0.72 | 1.00 | 0.82 | 0.57 |
| 11 | 0.70 | 0.70 | 0.65 | 0.62 | 0.62 | 0.72 | 0.47 | 0.62 | 0.60 | 0.82 | 1.00 | 0.62 |
| 12 | 0.62 | 0.62 | 0.57 | 0.57 | 0.70 | 0.50 | 0.65 | 0.70 | 0.68 | 0.57 | 0.62 | 1.00 |
The table contains GDT_TS values (calculated on the Cα atoms) between the predicted models.
Read more about the global distance test (GDT, also written as GDT_TS to represent "total score") measure.
© Laboratory of Theory of Biopolymers, Faculty of Chemistry, University of Warsaw 2013