Status: Done started: 2018-May-07 22:34:33 UTC
| Project Name | DENV1 |
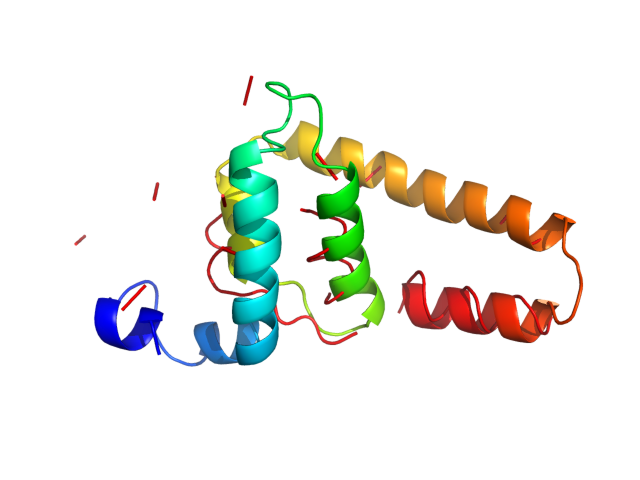
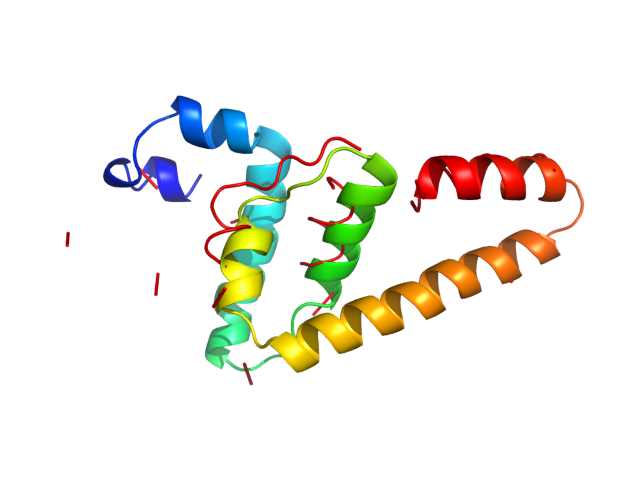
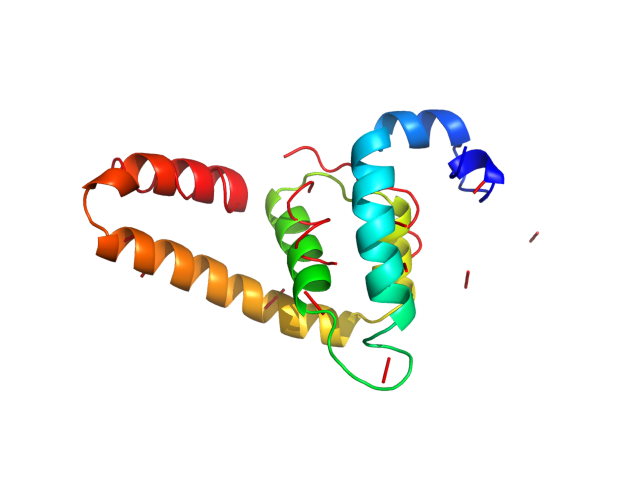
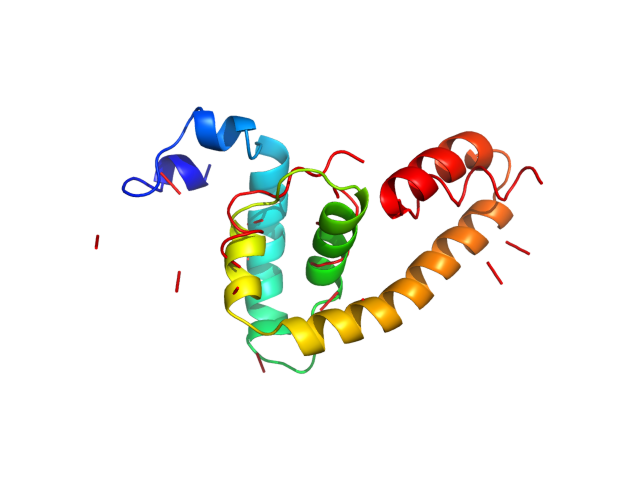
| Sequence | MNNQRKKTGR PSFNMLKRAR NRVSTVSQLA KRFSKGLLSG QGPMKLVMAF IAFLRFLAIP PTAGILARWG SFKKNGAIKV LRGFKKEISN MLNIMNRRKR SVTMLLMLLP TALA |
| Secondary structure | CHHHHCCCCC CHHHHHHHCC CCCCCCHHHH HHCCCCCCCC CCCCHHHHHH HHHHHCCCCC CCHHHHHCCC CCCHHHHHHH HHHHHHHHHH HHHHHHCCCC CHHHHHHHHH HHHC |
| Movie from predicted structures | To download the movie, right click on the desired file format:  
|
| Estimated finish time | 2018-May-08 03:08 UTC |
| Project Name | DENV1 |


| Project Name | DENV1 |
| Cluster # | 1 | 2 | 3 | 4 | 5 | 6 | 7 | 8 | 9 | 10 | 11 | 12 |
| Cluster density | 229.2 | 156.0 | 153.2 | 135.1 | 120.7 | 117.6 | 106.8 | 106.2 | 94.1 | 92.8 | 73.0 | 57.2 |
| Cluster size | 332 | 223 | 216 | 184 | 173 | 171 | 129 | 154 | 127 | 122 | 89 | 80 |
| Average cluster RMSD | 1.4 | 1.4 | 1.4 | 1.4 | 1.4 | 1.5 | 1.2 | 1.5 | 1.3 | 1.3 | 1.2 | 1.4 |
| # | 1 | 2 | 3 | 4 | 5 | 6 | 7 | 8 | 9 | 10 | 11 | 12 |
| RMSD | 5.85 | 5.60 | 5.52 | 5.98 | 6.97 | 5.90 | 5.59 | 7.26 | 5.91 | 6.77 | 5.81 | 4.97 |
| GDT_TS | 0.51 | 0.56 | 0.58 | 0.53 | 0.46 | 0.50 | 0.58 | 0.46 | 0.56 | 0.47 | 0.51 | 0.54 |
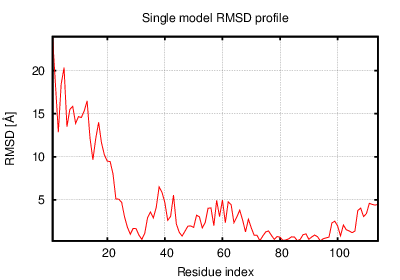
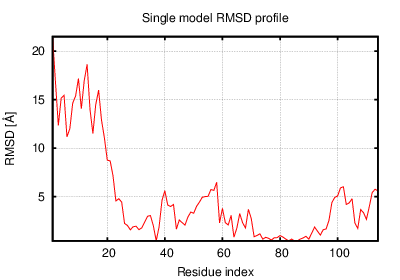
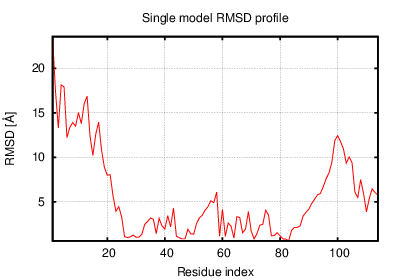
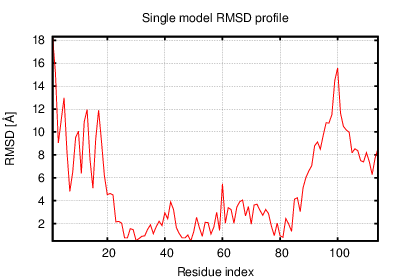
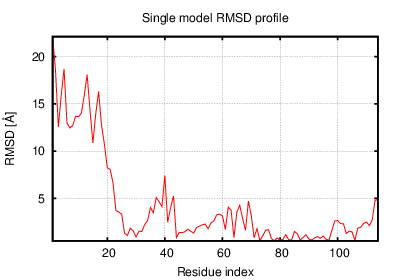
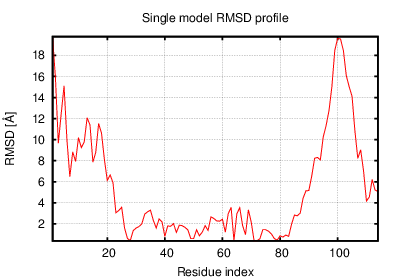
The table contains RMSD and GDT_TS values (calculated on the Cα atoms) between the predicted models and the input structure. Note that GDT_TS metric is intended as a more accurate measurement than the more common RMSD.
Read more about the root-mean-square deviation (RMSD) measure
Read more about the global distance test (GDT, also written as GDT_TS to represent "total score") measure.
| # | 1 | 2 | 3 | 4 | 5 | 6 | 7 | 8 | 9 | 10 | 11 | 12 |
| 1 | 0.00 | 2.51 | 2.34 | 1.65 | 1.84 | 2.66 | 2.58 | 2.57 | 2.27 | 2.75 | 2.64 | 2.90 |
| 2 | 2.51 | 0.00 | 2.83 | 2.34 | 3.25 | 2.96 | 1.90 | 3.69 | 1.70 | 3.73 | 2.10 | 3.00 |
| 3 | 2.34 | 2.83 | 0.00 | 2.76 | 3.17 | 2.36 | 2.34 | 3.85 | 2.81 | 3.93 | 2.25 | 2.34 |
| 4 | 1.65 | 2.34 | 2.76 | 0.00 | 2.21 | 2.75 | 2.29 | 2.85 | 1.99 | 2.99 | 2.48 | 2.93 |
| 5 | 1.84 | 3.25 | 3.17 | 2.21 | 0.00 | 3.17 | 3.26 | 2.04 | 2.94 | 2.47 | 3.13 | 3.77 |
| 6 | 2.66 | 2.96 | 2.36 | 2.75 | 3.17 | 0.00 | 2.82 | 3.66 | 3.11 | 3.57 | 2.44 | 2.46 |
| 7 | 2.58 | 1.90 | 2.34 | 2.29 | 3.26 | 2.82 | 0.00 | 4.00 | 2.13 | 3.96 | 1.66 | 2.73 |
| 8 | 2.57 | 3.69 | 3.85 | 2.85 | 2.04 | 3.66 | 4.00 | 0.00 | 3.58 | 1.57 | 3.83 | 4.28 |
| 9 | 2.27 | 1.70 | 2.81 | 1.99 | 2.94 | 3.11 | 2.13 | 3.58 | 0.00 | 3.76 | 2.25 | 3.22 |
| 10 | 2.75 | 3.73 | 3.93 | 2.99 | 2.47 | 3.57 | 3.96 | 1.57 | 3.76 | 0.00 | 3.73 | 3.99 |
| 11 | 2.64 | 2.10 | 2.25 | 2.48 | 3.13 | 2.44 | 1.66 | 3.83 | 2.25 | 3.73 | 0.00 | 2.63 |
| 12 | 2.90 | 3.00 | 2.34 | 2.93 | 3.77 | 2.46 | 2.73 | 4.28 | 3.22 | 3.99 | 2.63 | 0.00 |
The table contains RMSD values (calculated on the Cα atoms) between the predicted models.
Read more about the root-mean-square deviation (RMSD) measure.
| # | 1 | 2 | 3 | 4 | 5 | 6 | 7 | 8 | 9 | 10 | 11 | 12 |
| 1 | 1.00 | 0.73 | 0.73 | 0.84 | 0.79 | 0.64 | 0.66 | 0.71 | 0.76 | 0.71 | 0.67 | 0.70 |
| 2 | 0.73 | 1.00 | 0.70 | 0.73 | 0.62 | 0.64 | 0.77 | 0.61 | 0.83 | 0.60 | 0.73 | 0.72 |
| 3 | 0.73 | 0.70 | 1.00 | 0.69 | 0.64 | 0.72 | 0.77 | 0.62 | 0.73 | 0.62 | 0.76 | 0.78 |
| 4 | 0.84 | 0.73 | 0.69 | 1.00 | 0.74 | 0.62 | 0.70 | 0.70 | 0.78 | 0.65 | 0.68 | 0.67 |
| 5 | 0.79 | 0.62 | 0.64 | 0.74 | 1.00 | 0.61 | 0.63 | 0.76 | 0.64 | 0.71 | 0.64 | 0.60 |
| 6 | 0.64 | 0.64 | 0.72 | 0.62 | 0.61 | 1.00 | 0.66 | 0.60 | 0.65 | 0.62 | 0.74 | 0.71 |
| 7 | 0.66 | 0.77 | 0.77 | 0.70 | 0.63 | 0.66 | 1.00 | 0.61 | 0.76 | 0.60 | 0.80 | 0.71 |
| 8 | 0.71 | 0.61 | 0.62 | 0.70 | 0.76 | 0.60 | 0.61 | 1.00 | 0.62 | 0.86 | 0.62 | 0.55 |
| 9 | 0.76 | 0.83 | 0.73 | 0.78 | 0.64 | 0.65 | 0.76 | 0.62 | 1.00 | 0.63 | 0.70 | 0.71 |
| 10 | 0.71 | 0.60 | 0.62 | 0.65 | 0.71 | 0.62 | 0.60 | 0.86 | 0.63 | 1.00 | 0.64 | 0.61 |
| 11 | 0.67 | 0.73 | 0.76 | 0.68 | 0.64 | 0.74 | 0.80 | 0.62 | 0.70 | 0.64 | 1.00 | 0.72 |
| 12 | 0.70 | 0.72 | 0.78 | 0.67 | 0.60 | 0.71 | 0.71 | 0.55 | 0.71 | 0.61 | 0.72 | 1.00 |
The table contains GDT_TS values (calculated on the Cα atoms) between the predicted models.
Read more about the global distance test (GDT, also written as GDT_TS to represent "total score") measure.
© Laboratory of Theory of Biopolymers, Faculty of Chemistry, University of Warsaw 2013