Status: Done started: 2018-May-05 10:48:58 UTC
| Project Name | 14-3-3 |
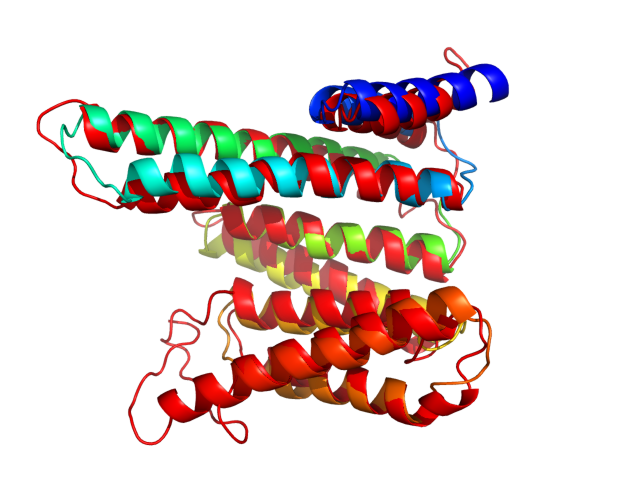
| Sequence | MSVDKEELVQ RAKLAEQAER YDDMAVAMKE VTETGVELSN EERNLLSVAY KNVVGARRSS WRVISSIGQK TEGSERKQQM AKEYRVKVEK ELREICYDVL GLLDKHLIPK ASNPESKVFY LKMKGDYYRY LAEVATGETR NSVVEDSRKA YQDALEISKA KMQPTHPIRL GLALNFSVFY YEILNSPDKA CQLAKQAFDD AIAELDTLNE DSYKDSTLIM QLLRDNLTLW TSDTQGDGDE PAEGGDN |
| Secondary structure | CCCCHHHHHH HHHHHHHCCC HHHHHHHHHH HHHCCCCCCH HHHHHHHHHH HHHHHHHHHH HHHHHHHHHC CCCCCCHHHH HHHHHHHHHH HHHHHHHHHH HHHHHCCCCC CCCHHHHHHH HHHHHHHHHH HHHHCCCCCH HHHHHHHHHH HHHHHHHHHH HCCCCCHHHH HHHHHHHHHH HHCCCCHHHH HHHHHHHHHH HHHCCCCCCC CCHHHHHHHH HHHHHHHHHH CCCCCCCCCC CCCCCCC |
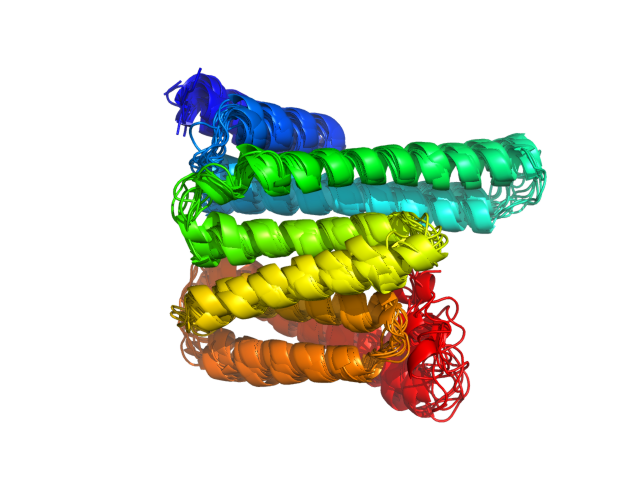
| Movie from predicted structures | To download the movie, right click on the desired file format:  
|
| Estimated finish time | 2018-May-05 15:40 UTC |
| Project Name | 14-3-3 |


| Project Name | 14-3-3 |
| Cluster # | 1 | 2 | 3 | 4 | 5 | 6 | 7 | 8 | 9 | 10 | 11 | 12 |
| Cluster density | 246.1 | 152.1 | 136.4 | 133.2 | 117.3 | 115.2 | 106.5 | 104.4 | 90.7 | 82.7 | 71.7 | 63.5 |
| Cluster size | 349 | 224 | 198 | 200 | 156 | 155 | 147 | 141 | 139 | 114 | 99 | 78 |
| Average cluster RMSD | 1.4 | 1.5 | 1.5 | 1.5 | 1.3 | 1.3 | 1.4 | 1.4 | 1.5 | 1.4 | 1.4 | 1.2 |
| # | 1 | 2 | 3 | 4 | 5 | 6 | 7 | 8 | 9 | 10 | 11 | 12 |
| RMSD | 3.19 | 3.71 | 2.90 | 3.31 | 3.60 | 3.02 | 3.01 | 3.96 | 3.50 | 3.12 | 3.64 | 3.79 |
| GDT_TS | 0.68 | 0.65 | 0.69 | 0.64 | 0.65 | 0.71 | 0.71 | 0.59 | 0.69 | 0.67 | 0.64 | 0.62 |
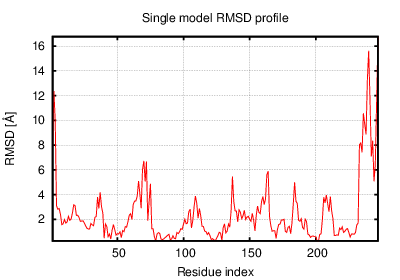
The table contains RMSD and GDT_TS values (calculated on the Cα atoms) between the predicted models and the input structure. Note that GDT_TS metric is intended as a more accurate measurement than the more common RMSD.
Read more about the root-mean-square deviation (RMSD) measure
Read more about the global distance test (GDT, also written as GDT_TS to represent "total score") measure.
| # | 1 | 2 | 3 | 4 | 5 | 6 | 7 | 8 | 9 | 10 | 11 | 12 |
| 1 | 0.00 | 2.90 | 2.20 | 2.36 | 2.80 | 2.17 | 2.43 | 3.07 | 2.34 | 2.55 | 2.48 | 3.19 |
| 2 | 2.90 | 0.00 | 2.80 | 2.89 | 3.44 | 2.54 | 2.93 | 3.34 | 3.58 | 2.82 | 3.25 | 2.91 |
| 3 | 2.20 | 2.80 | 0.00 | 2.48 | 2.51 | 2.11 | 2.19 | 2.83 | 2.48 | 2.32 | 2.28 | 2.65 |
| 4 | 2.36 | 2.89 | 2.48 | 0.00 | 2.10 | 2.89 | 2.49 | 2.52 | 2.22 | 2.04 | 2.50 | 2.50 |
| 5 | 2.80 | 3.44 | 2.51 | 2.10 | 0.00 | 2.92 | 2.86 | 2.18 | 2.41 | 2.00 | 2.38 | 2.50 |
| 6 | 2.17 | 2.54 | 2.11 | 2.89 | 2.92 | 0.00 | 2.30 | 3.09 | 2.84 | 2.66 | 2.45 | 2.90 |
| 7 | 2.43 | 2.93 | 2.19 | 2.49 | 2.86 | 2.30 | 0.00 | 3.14 | 2.71 | 2.46 | 2.61 | 3.09 |
| 8 | 3.07 | 3.34 | 2.83 | 2.52 | 2.18 | 3.09 | 3.14 | 0.00 | 2.56 | 2.39 | 2.38 | 1.95 |
| 9 | 2.34 | 3.58 | 2.48 | 2.22 | 2.41 | 2.84 | 2.71 | 2.56 | 0.00 | 2.37 | 2.54 | 2.99 |
| 10 | 2.55 | 2.82 | 2.32 | 2.04 | 2.00 | 2.66 | 2.46 | 2.39 | 2.37 | 0.00 | 2.67 | 2.29 |
| 11 | 2.48 | 3.25 | 2.28 | 2.50 | 2.38 | 2.45 | 2.61 | 2.38 | 2.54 | 2.67 | 0.00 | 2.44 |
| 12 | 3.19 | 2.91 | 2.65 | 2.50 | 2.50 | 2.90 | 3.09 | 1.95 | 2.99 | 2.29 | 2.44 | 0.00 |
The table contains RMSD values (calculated on the Cα atoms) between the predicted models.
Read more about the root-mean-square deviation (RMSD) measure.
| # | 1 | 2 | 3 | 4 | 5 | 6 | 7 | 8 | 9 | 10 | 11 | 12 |
| 1 | 1.00 | 0.72 | 0.72 | 0.72 | 0.67 | 0.74 | 0.69 | 0.66 | 0.77 | 0.73 | 0.70 | 0.65 |
| 2 | 0.72 | 1.00 | 0.73 | 0.78 | 0.75 | 0.70 | 0.69 | 0.69 | 0.72 | 0.78 | 0.69 | 0.73 |
| 3 | 0.72 | 0.73 | 1.00 | 0.71 | 0.73 | 0.75 | 0.73 | 0.69 | 0.76 | 0.74 | 0.79 | 0.71 |
| 4 | 0.72 | 0.78 | 0.71 | 1.00 | 0.78 | 0.66 | 0.70 | 0.70 | 0.73 | 0.80 | 0.73 | 0.76 |
| 5 | 0.67 | 0.75 | 0.73 | 0.78 | 1.00 | 0.72 | 0.66 | 0.74 | 0.72 | 0.81 | 0.76 | 0.77 |
| 6 | 0.74 | 0.70 | 0.75 | 0.66 | 0.72 | 1.00 | 0.73 | 0.64 | 0.78 | 0.71 | 0.73 | 0.68 |
| 7 | 0.69 | 0.69 | 0.73 | 0.70 | 0.66 | 0.73 | 1.00 | 0.62 | 0.73 | 0.70 | 0.71 | 0.66 |
| 8 | 0.66 | 0.69 | 0.69 | 0.70 | 0.74 | 0.64 | 0.62 | 1.00 | 0.70 | 0.73 | 0.75 | 0.77 |
| 9 | 0.77 | 0.72 | 0.76 | 0.73 | 0.72 | 0.78 | 0.73 | 0.70 | 1.00 | 0.75 | 0.73 | 0.68 |
| 10 | 0.73 | 0.78 | 0.74 | 0.80 | 0.81 | 0.71 | 0.70 | 0.73 | 0.75 | 1.00 | 0.72 | 0.77 |
| 11 | 0.70 | 0.69 | 0.79 | 0.73 | 0.76 | 0.73 | 0.71 | 0.75 | 0.73 | 0.72 | 1.00 | 0.73 |
| 12 | 0.65 | 0.73 | 0.71 | 0.76 | 0.77 | 0.68 | 0.66 | 0.77 | 0.68 | 0.77 | 0.73 | 1.00 |
The table contains GDT_TS values (calculated on the Cα atoms) between the predicted models.
Read more about the global distance test (GDT, also written as GDT_TS to represent "total score") measure.
© Laboratory of Theory of Biopolymers, Faculty of Chemistry, University of Warsaw 2013