Status: Done started: 2018-Apr-13 15:16:37 UTC
| Project Name | Control_50_137_143 |
| Sequence | SEACRDGLRA VMECRNVTHL LQQELTEAQK GFQDVEAQAA TCNHTVMALM ASLDAEKAQG QKKVEELEGE ITTLNHKLQD ASAEVERLRR ENQVLSVRIA DKKYYPSSQ |
| Secondary structure | CCHHHHHHHH HHHHHHHHHH HHHHHHHHHH HHHHHHHHHH HHHHHHHHHH HHHHHHHHHH HHHHHHHHHH HHHHHHHHHH HHHHHHHHHH HHHHHHHHHH CCCCCCCCC |
| Movie from predicted structures | To download the movie, right click on the desired file format:  
|
| Estimated finish time | 2018-Apr-13 19:49 UTC |
| Project Name | Control_50_137_143 |
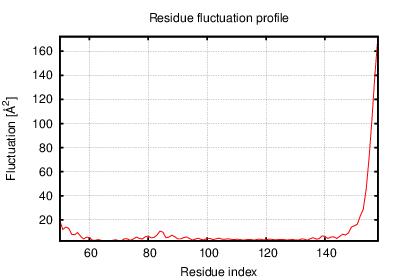
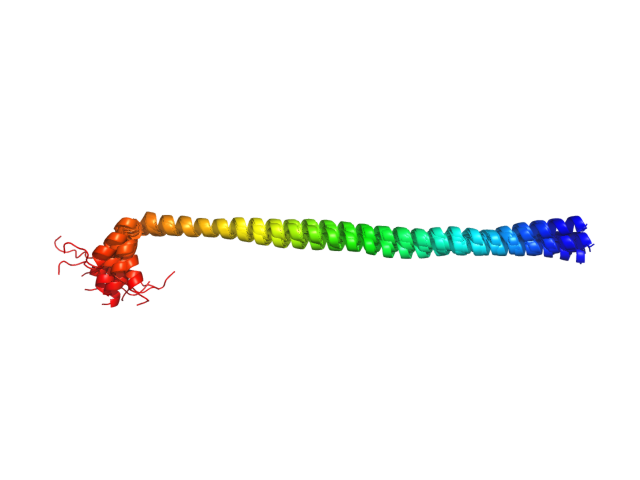
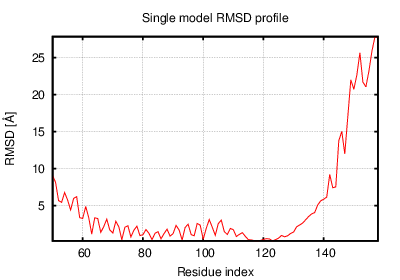
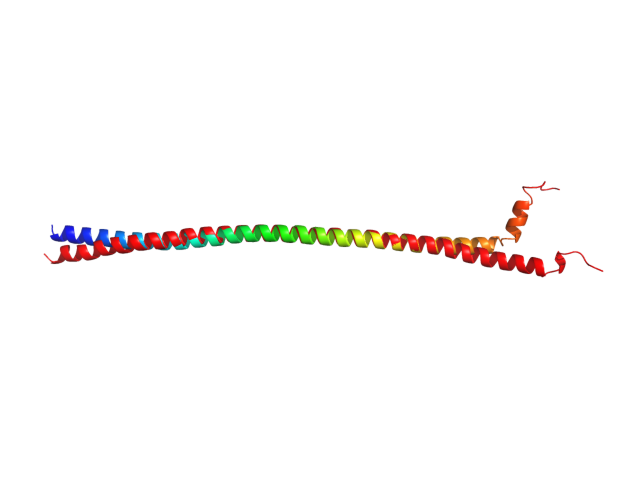
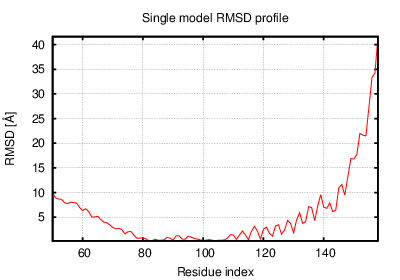
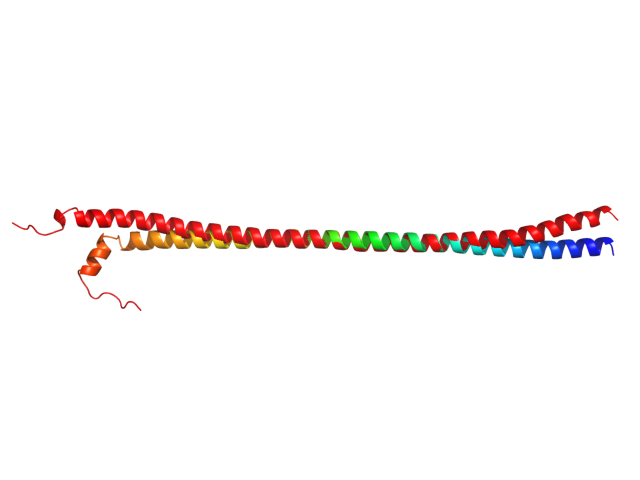
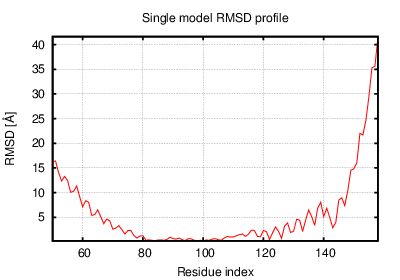
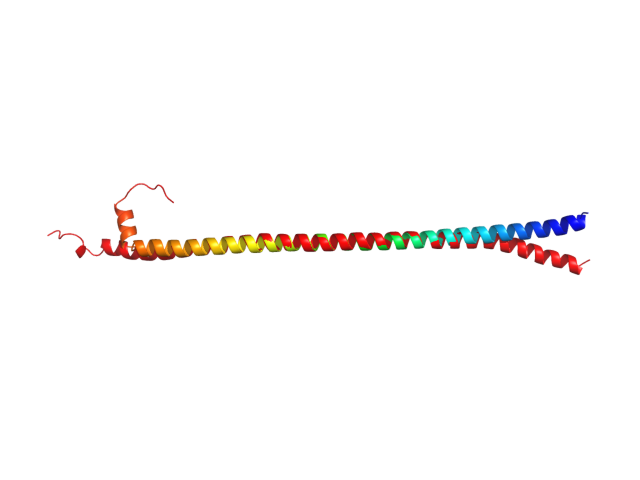
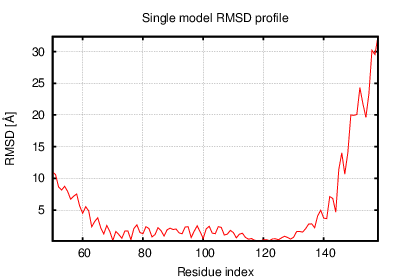
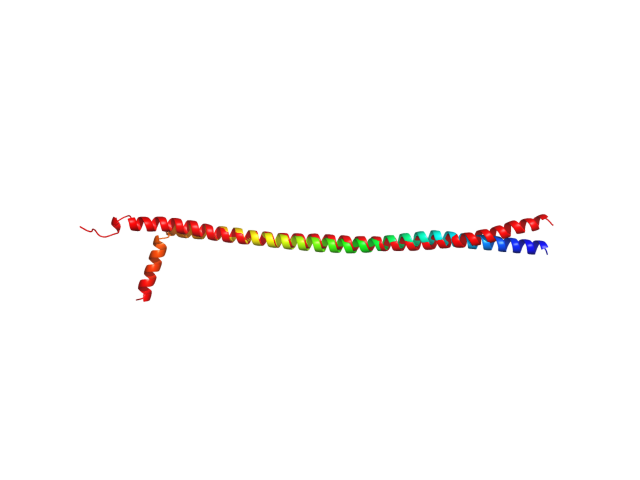
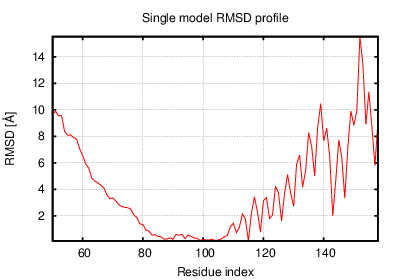
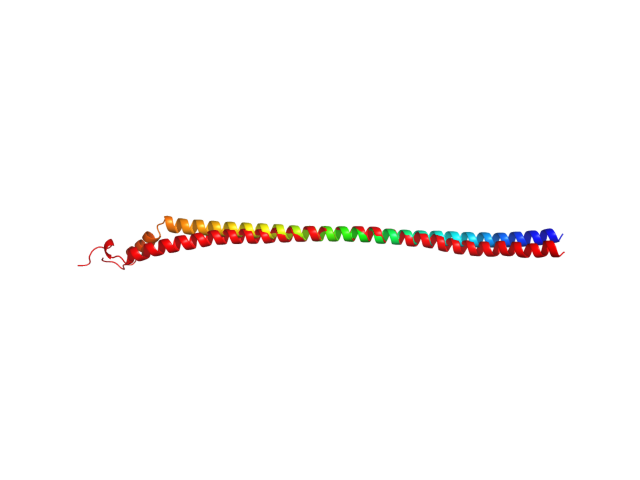
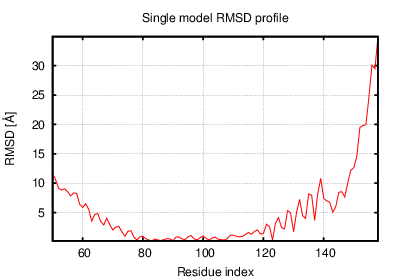
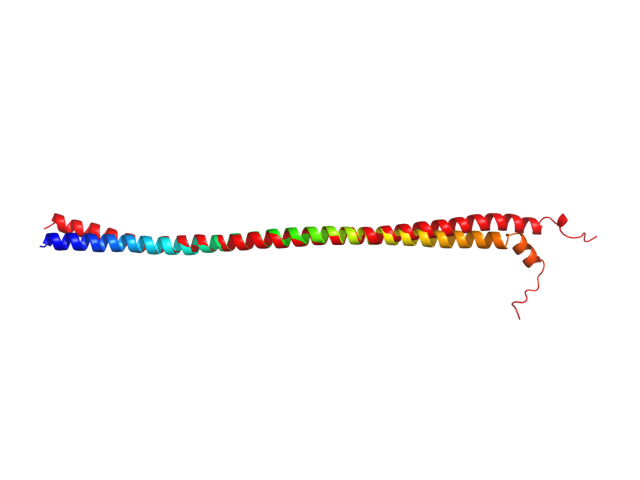
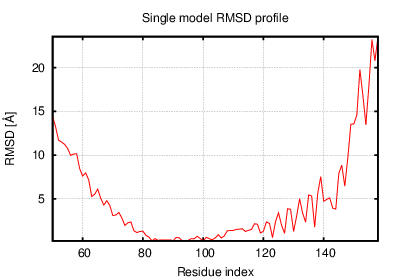
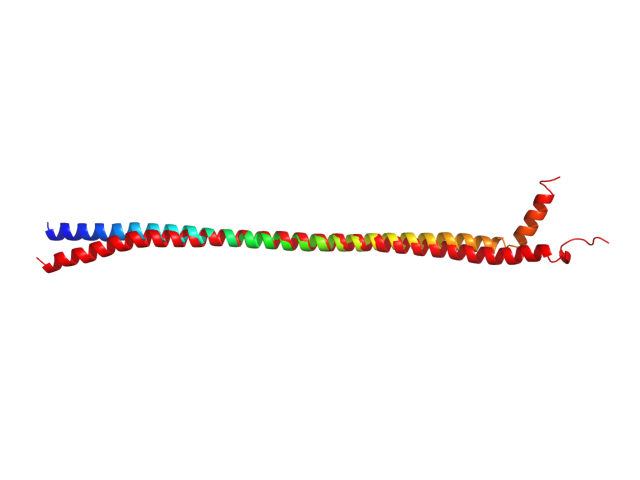
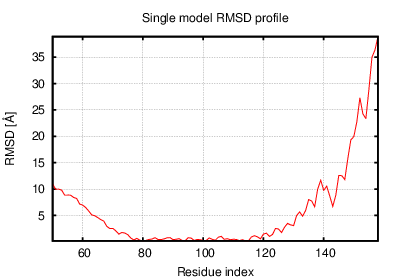
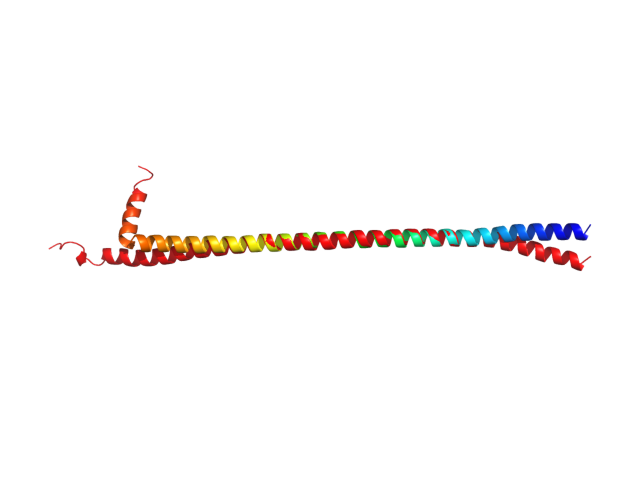
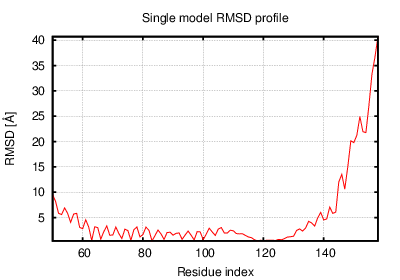
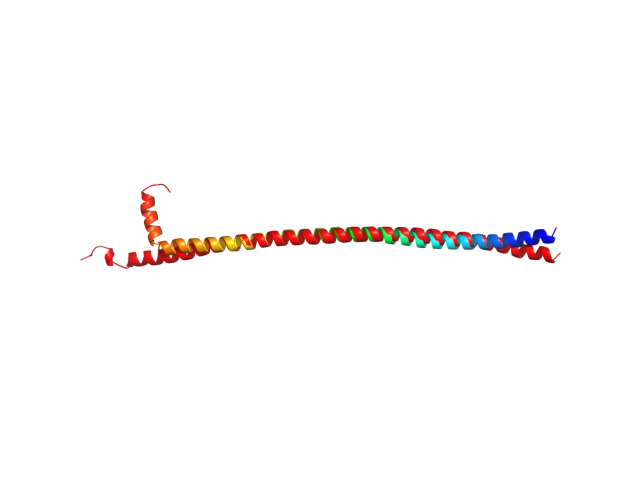
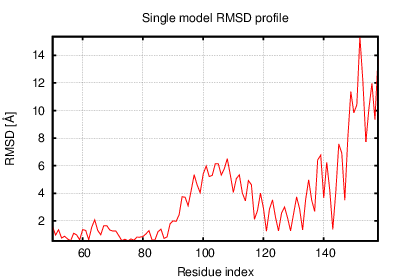
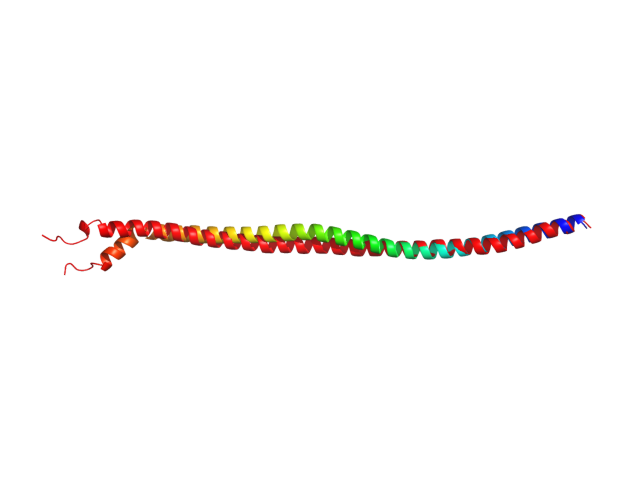
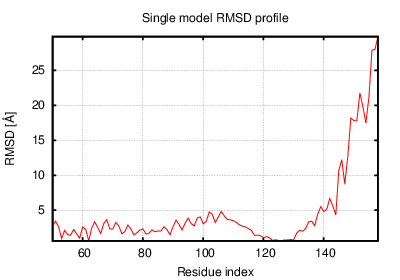
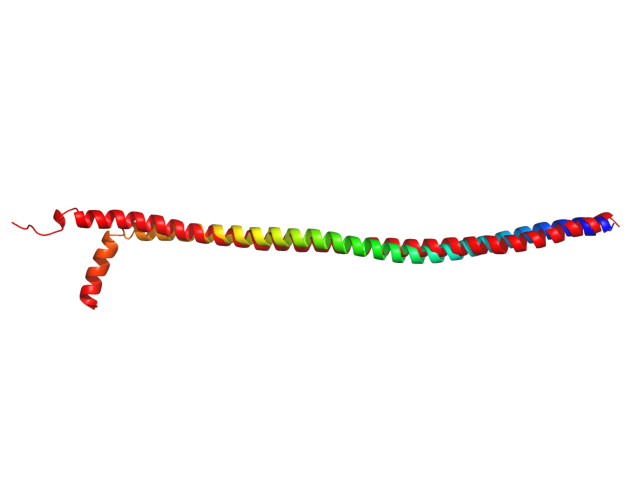
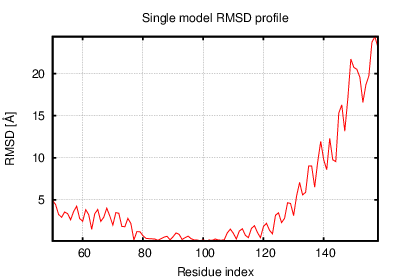
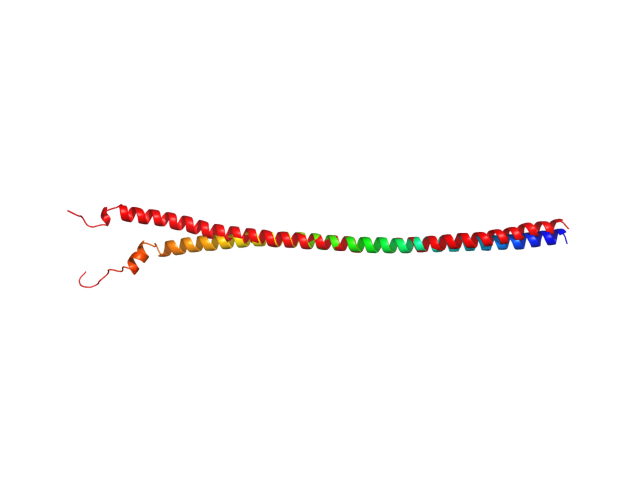
| Project Name | Control_50_137_143 |
| Cluster # | 1 | 2 | 3 | 4 | 5 | 6 | 7 | 8 | 9 | 10 | 11 | 12 |
| Cluster density | 117.6 | 83.8 | 78.8 | 75.4 | 75.2 | 72.9 | 72.8 | 66.6 | 66.3 | 66.0 | 46.1 | 32.0 |
| Cluster size | 272 | 164 | 178 | 181 | 173 | 164 | 178 | 128 | 162 | 167 | 146 | 87 |
| Average cluster RMSD | 2.3 | 2.0 | 2.3 | 2.4 | 2.3 | 2.2 | 2.4 | 1.9 | 2.4 | 2.5 | 3.2 | 2.7 |
| # | 1 | 2 | 3 | 4 | 5 | 6 | 7 | 8 | 9 | 10 | 11 | 12 |
| RMSD | 6.41 | 7.17 | 8.36 | 6.58 | 4.37 | 6.30 | 5.43 | 8.12 | 7.69 | 4.36 | 6.02 | 4.48 |
| GDT_TS | 0.60 | 0.58 | 0.58 | 0.63 | 0.60 | 0.60 | 0.59 | 0.60 | 0.60 | 0.63 | 0.60 | 0.64 |
The table contains RMSD and GDT_TS values (calculated on the Cα atoms) between the predicted models and the input structure. Note that GDT_TS metric is intended as a more accurate measurement than the more common RMSD.
Read more about the root-mean-square deviation (RMSD) measure
Read more about the global distance test (GDT, also written as GDT_TS to represent "total score") measure.
| # | 1 | 2 | 3 | 4 | 5 | 6 | 7 | 8 | 9 | 10 | 11 | 12 |
| 1 | 0.00 | 4.18 | 5.07 | 2.55 | 3.41 | 3.58 | 2.59 | 4.01 | 3.25 | 3.49 | 3.20 | 3.52 |
| 2 | 4.18 | 0.00 | 2.64 | 3.24 | 4.76 | 2.12 | 3.19 | 2.91 | 2.91 | 5.49 | 3.89 | 5.65 |
| 3 | 5.07 | 2.64 | 0.00 | 3.83 | 5.72 | 3.53 | 4.66 | 2.59 | 2.86 | 6.70 | 4.92 | 7.06 |
| 4 | 2.55 | 3.24 | 3.83 | 0.00 | 3.79 | 2.85 | 2.53 | 2.73 | 2.23 | 4.40 | 3.09 | 4.91 |
| 5 | 3.41 | 4.76 | 5.72 | 3.79 | 0.00 | 3.92 | 2.81 | 5.13 | 4.84 | 3.03 | 3.71 | 3.62 |
| 6 | 3.58 | 2.12 | 3.53 | 2.85 | 3.92 | 0.00 | 2.04 | 3.11 | 3.04 | 4.54 | 3.30 | 4.83 |
| 7 | 2.59 | 3.19 | 4.66 | 2.53 | 2.81 | 2.04 | 0.00 | 3.84 | 3.56 | 3.57 | 3.17 | 3.59 |
| 8 | 4.01 | 2.91 | 2.59 | 2.73 | 5.13 | 3.11 | 3.84 | 0.00 | 2.12 | 5.86 | 3.99 | 6.50 |
| 9 | 3.25 | 2.91 | 2.86 | 2.23 | 4.84 | 3.04 | 3.56 | 2.12 | 0.00 | 5.16 | 3.30 | 5.81 |
| 10 | 3.49 | 5.49 | 6.70 | 4.40 | 3.03 | 4.54 | 3.57 | 5.86 | 5.16 | 0.00 | 2.91 | 3.15 |
| 11 | 3.20 | 3.89 | 4.92 | 3.09 | 3.71 | 3.30 | 3.17 | 3.99 | 3.30 | 2.91 | 0.00 | 4.74 |
| 12 | 3.52 | 5.65 | 7.06 | 4.91 | 3.62 | 4.83 | 3.59 | 6.50 | 5.81 | 3.15 | 4.74 | 0.00 |
The table contains RMSD values (calculated on the Cα atoms) between the predicted models.
Read more about the root-mean-square deviation (RMSD) measure.
| # | 1 | 2 | 3 | 4 | 5 | 6 | 7 | 8 | 9 | 10 | 11 | 12 |
| 1 | 1.00 | 0.73 | 0.70 | 0.82 | 0.71 | 0.71 | 0.73 | 0.78 | 0.88 | 0.69 | 0.74 | 0.71 |
| 2 | 0.73 | 1.00 | 0.80 | 0.69 | 0.87 | 0.83 | 0.86 | 0.77 | 0.70 | 0.63 | 0.64 | 0.82 |
| 3 | 0.70 | 0.80 | 1.00 | 0.76 | 0.82 | 0.76 | 0.81 | 0.80 | 0.72 | 0.62 | 0.66 | 0.73 |
| 4 | 0.82 | 0.69 | 0.76 | 1.00 | 0.71 | 0.69 | 0.73 | 0.76 | 0.88 | 0.64 | 0.68 | 0.67 |
| 5 | 0.71 | 0.87 | 0.82 | 0.71 | 1.00 | 0.82 | 0.83 | 0.77 | 0.68 | 0.66 | 0.68 | 0.81 |
| 6 | 0.71 | 0.83 | 0.76 | 0.69 | 0.82 | 1.00 | 0.90 | 0.76 | 0.70 | 0.63 | 0.62 | 0.79 |
| 7 | 0.73 | 0.86 | 0.81 | 0.73 | 0.83 | 0.90 | 1.00 | 0.77 | 0.72 | 0.68 | 0.65 | 0.79 |
| 8 | 0.78 | 0.77 | 0.80 | 0.76 | 0.77 | 0.76 | 0.77 | 1.00 | 0.78 | 0.63 | 0.66 | 0.73 |
| 9 | 0.88 | 0.70 | 0.72 | 0.88 | 0.68 | 0.70 | 0.72 | 0.78 | 1.00 | 0.67 | 0.70 | 0.68 |
| 10 | 0.69 | 0.63 | 0.62 | 0.64 | 0.66 | 0.63 | 0.68 | 0.63 | 0.67 | 1.00 | 0.84 | 0.68 |
| 11 | 0.74 | 0.64 | 0.66 | 0.68 | 0.68 | 0.62 | 0.65 | 0.66 | 0.70 | 0.84 | 1.00 | 0.67 |
| 12 | 0.71 | 0.82 | 0.73 | 0.67 | 0.81 | 0.79 | 0.79 | 0.73 | 0.68 | 0.68 | 0.67 | 1.00 |
The table contains GDT_TS values (calculated on the Cα atoms) between the predicted models.
Read more about the global distance test (GDT, also written as GDT_TS to represent "total score") measure.
© Laboratory of Theory of Biopolymers, Faculty of Chemistry, University of Warsaw 2013